Fig. 1.
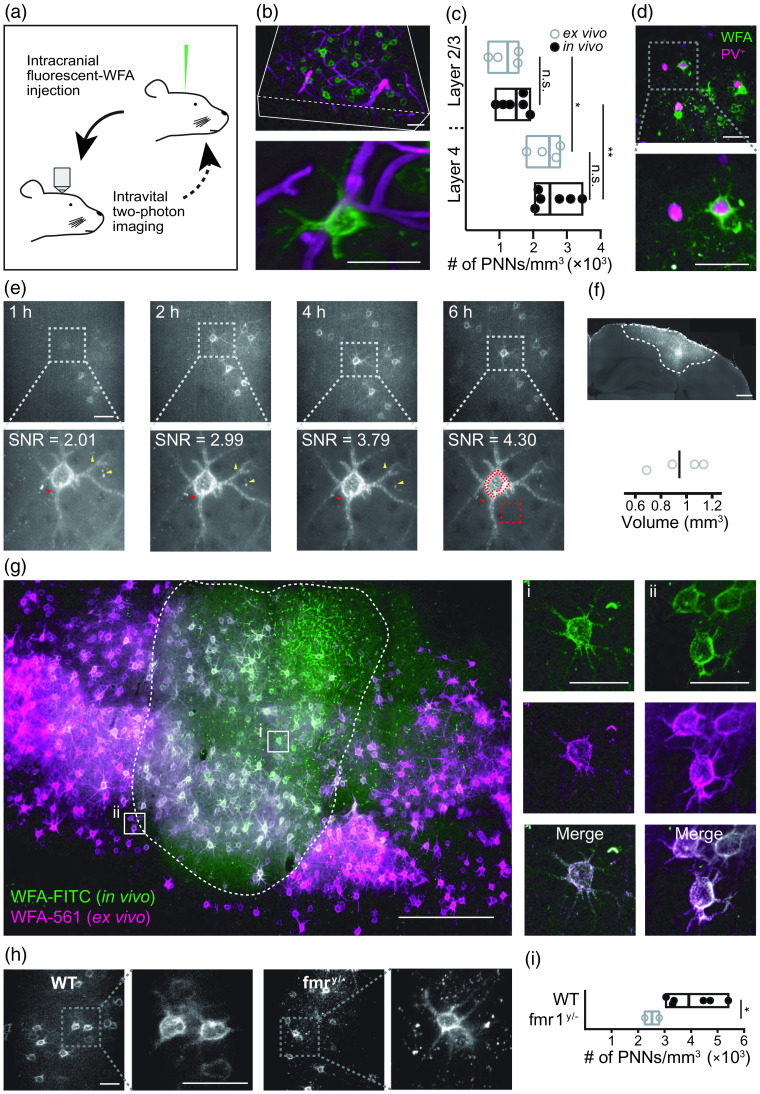
Intracranial injection of fluorescent-WFA rapidly and robustly labels PNNs for longitudinal intravital imaging. (a) A diagram representing the workflow used in the study. Stereotactic injection of fluorescent-WFA was followed by intravital two-photon imaging for measuring activity in awake animals, for observing PNNs, or for monitoring enzymatic degradation and synthesis of PNNs. Our system allowed multiple injections and longitudinal imaging. (b) Injection of FITC-conjugated WFA allowed in vivo imaging of PNNs in high resolution with minimal unspecific staining. Top image represents a 3D-reconstruction of a partial stack (200 to deep into the cortex), and bottom image represent a -projection of a single PNN covering the neuron soma and initial segments of the dendrites. Green, WFA and magenta, blood vessels. (c) The number of PNNs counted in layers 2 to 4 in vivo ( mice) was similar to the number of PNNs counted in histological sections ( mice; layers 2/3, ; layer 4, ), whereas in both in vivo and ex vivo, we found more PNNs in layer 4 compared with layers 2/3 (in vivo, ; ex vivo, ; ordinary one-way ANOVA, , ). Box plots represent median with min–max values. (d) PNN staining (green) in tdTomato (magenta) mice. (e) PNNs were visiable in vivo as early as 1 h following intracranial injection of WFA-FITC, and SNR more than doubled in the first 6 h and remained stable thereafter. SNR was calculated based on maximum intensity -projections as median value of free-form encompasing the PNN over median value of square in the background, as indicated in the bottom right image. Red arrowheads point to specific staining that improved over time and yellow arrow heads point to nonspecific staining that reduced or disappeared over time. (f) Quantification of the volume stained by a single injection of WFA-FITC at 50 to from pial surface, 4 days following injection. (g) Histological analysis of brains 60 days following WFA-FITC (green) injection revealed that all PNNs around the injection site were labeled, as indicated by ex vivo staining (magenta) with WFA-Alexa Fluor 561. (h) In vivo PNN imaging allowed visualizing PNNs in Fmr1-knockout mice. (i) Quantification of the PNNs indicated there was significantly less PNNs in Fmr1-knockout mice compared with WT mice (Welch’s two-sided unpaired -test, , ). Box plots represent median with min–max values. Images represent a maximum intensity projection. Scale bars are for (b)–(e), and (h), for (f)–(g), and for insets in (g). See also Figs. S1–S3 in the Supplementary Material and Videos 1–4 (Video 1, MOV, 11.4 MB [URL: https://doi.org/10.1117/1.NPh.10.1.015008.s1]; Video 2, MP4, 1.44 MB [URL: https://doi.org/10.1117/1.NPh.10.1.015008.s2]; Video 3, MOV, 10.9 MB [URL: https://doi.org/10.1117/1.NPh.10.1.015008.s3]; and Video 4, MOV, 11.2 MB [URL: https://doi.org/10.1117/1.NPh.10.1.015008.s4].).

