Fig. 3.
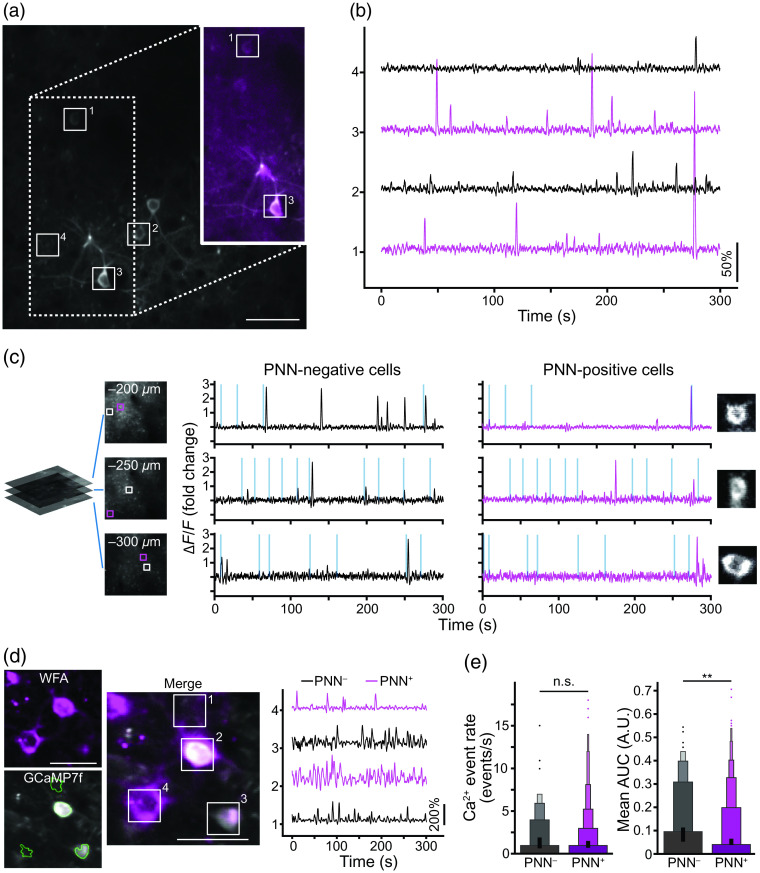
Intravital calcium imaging of mice with labeled PNNs. (a) A representative GCaMP6s-labeled field of view (FOV) with markings of some of the detected active components. The FOV was captured at 30 Hz, with the depicted image being 1000 frames average for display purposes only. Inset – 30 frames averaged image of cells (WFA-Atto590; magenta) overlaying the GCaMP image (grayscale). (b) Representative traces of the marked cells with a PNN (magenta) and without a PNN (black). (c) Representative traces of (left; black) and (right; magenta) neurons at different cortical depths (measured from pia) in a mouse injected with WFA-FITC and RCaMP7. Vertical lines in the traces indicate the timing of whisker stimulation and are scaled to 300% change. (d) A representative FOV of cells expressing labeled with WFA-Alexa594 (magenta) and GCaMP7f (gray) with marking of some of the detected active components (as detected by CaImAn), with their corresponding traces of the marked cells with a PNN (magenta) and without a PNN (black) (see Video 5, MOV, 1.52 MB [URL: https://doi.org/10.1117/1.NPh.10.1.015008.s5]). (e) The calcium transient event rate in the barrel cortex was similar between and PV cells, while the mean AUCs of the traces were significantly higher in PV cells compared to cells in the same mouse ( mouse, 147 cells and 1025 cells, unpaired two-tailed student -test, , ). Moreover, the variance of the mean AUCs of cells was significantly larger compared to PV cells (Levene’s test, ). Data were averaged to 1 fps for display purposes only. Scale bars are .

