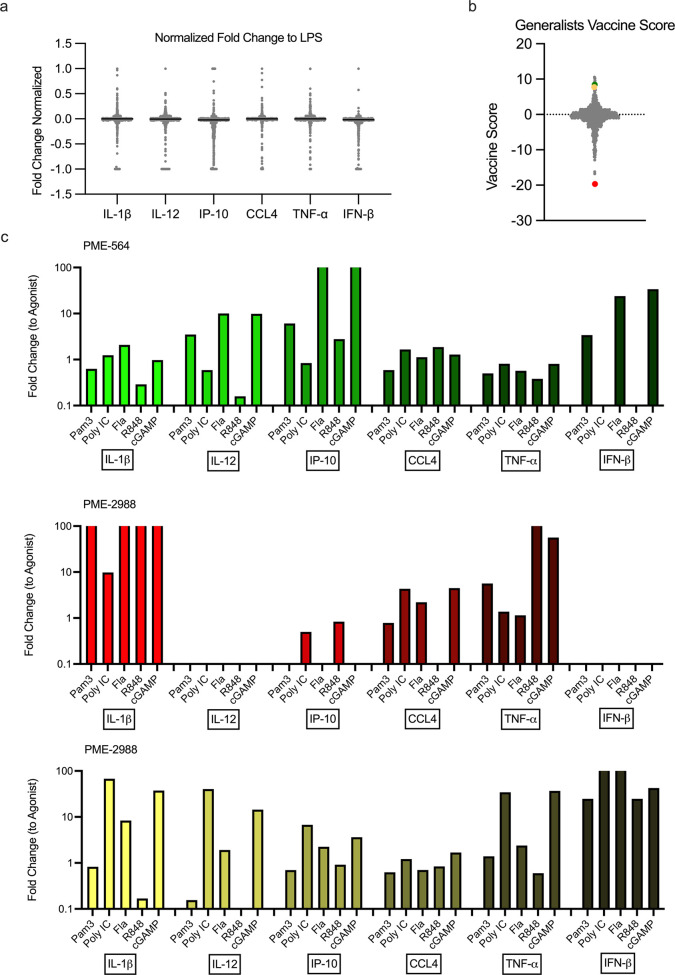
Figure 4.
Demonstration of modulator analysis through a “vaccine score”. (A) Representative normalized cytokine distributions for one agonist, LPS (N = 720). (B) Fold changes for cytokines were multiplied by weight factors and summed to obtain agonist specific “vaccine scores”. All agonist scores were combined to create the generalist score (N = 720). (C) Cytokine production of a top vaccine score candidate, PME-564 (green), a negative score candidate, PME-2988 (red), and a candidate for additional applications, PME-2539 (yellow). Modulator + agonist activity reported as a fold change compared to agonist alone activity.

