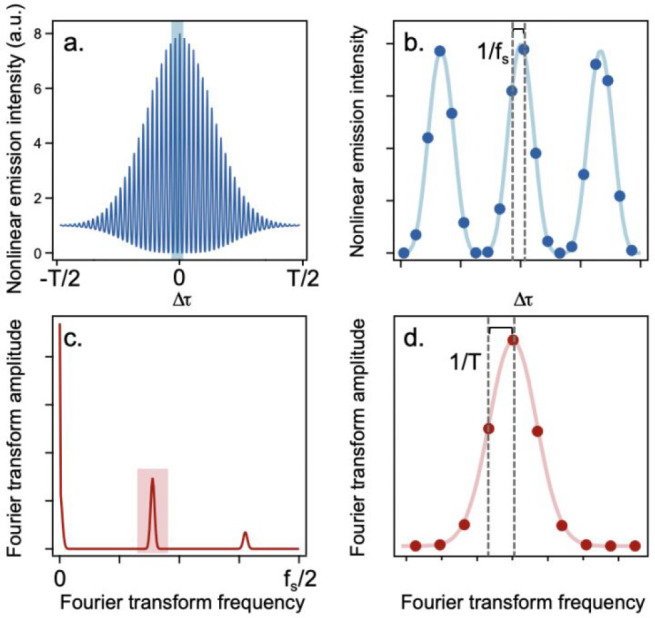
Figure 3.

Relationship between temporal and frequency ranges and resolution in Fourier transform spectroscopy. (a) An example interferogram over the full range of time delays, T. (b) the portion of the interferogram highlighted in blue in panel a. Each dark blue marker represents an experimental data point at a given interpulse delay time, Δτ. The separation between each data point defines the sampling frequency, fs. The temporal parameters determine the frequency resolution and range of the Fourier transform spectrum (c,d). The highest energy resolved is given by fs/2 (c). Panel d, showing the region of panel c highlighted in pink, depicts the separation between data points in the Fourier transform spectrum which is given by 1/T.
