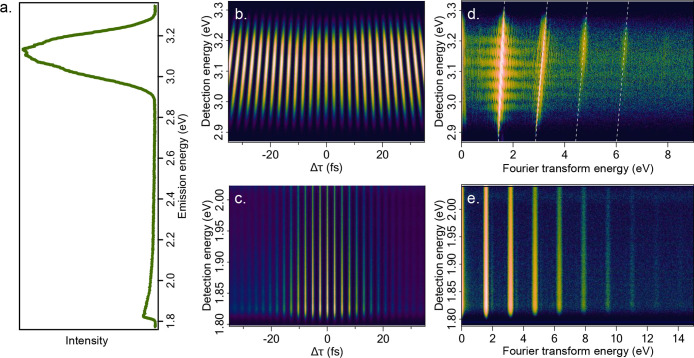
Figure 7.
Spectrally resolved FT-NLO enables excitation/detection correlations in MoS2. (a) Steady-state emission spectrum of redox-exfoliated MoS2 exhibits a large peak at 3.1 eV, as well as a broad emission at lower energies, which are attributed to SHG and MPPL, respectively. The emission spectra of the SHG (b) and MPPL (c) are collected as a function of interpulse time delay to generate the spectrally resolved interferograms. The interferograms are Fourier transformed along the time axis to generate excitation/detection correlation maps (d,e). These maps confirm that the signal at 3.1 eV is parametric, due to the diagonal dependence of the signal (d), while the signal at 1.9 eV is nonparametric and has no dependence on the excitation energy (e). Adapted from ref (41). Copyright 2022 American Chemical Society.

