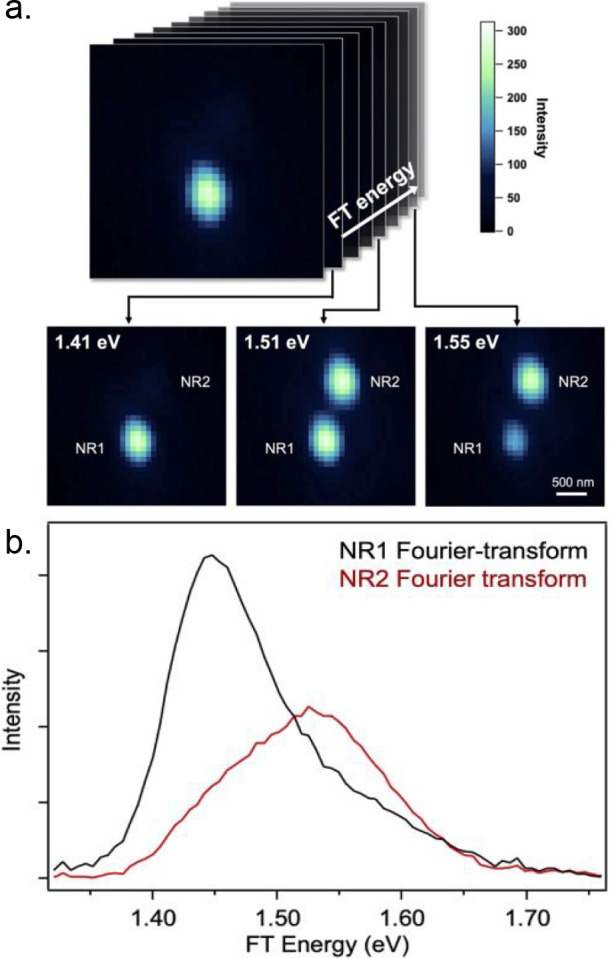
Figure 9.

Performing hyperspectral imaging of gold nanorods with FT-NLO microscopy. (a) Spatial resolution of the nonlinear signal allows the generation of a 3D data set consisting of an image of the sample at each Fourier energy. In this example, selected slices of the 3D data set for two gold nanorods are shown. (b) Resonance spectrum of the two rods are obtained from the data set in panel a. Reprinted in part with permission from ref (22). Copyright 2022 AIP Publishing.
