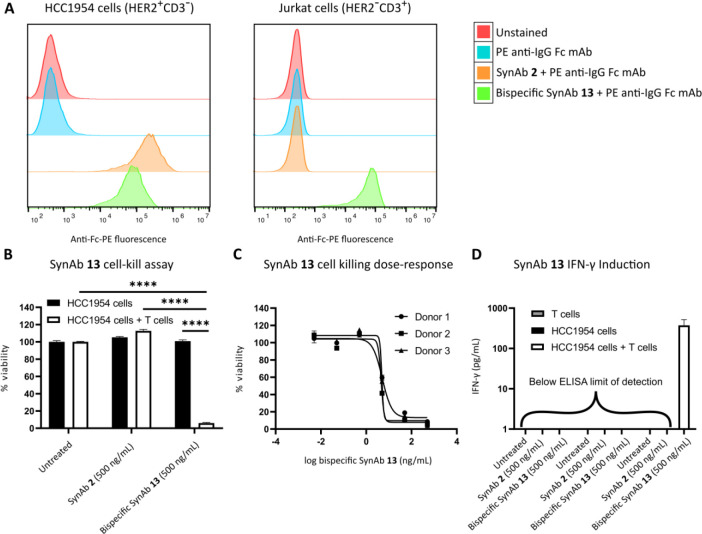
Figure 4.
Biological testing of SynAbs 2 and 13. A Binding of SynAb 2 and bispecific SynAb 13 to HCC1954 (HER2+CD3–) and Jurkat (HER2–CD3+) cells. Flow cytometry histograms representative of three independent experiments. Cells were incubated with SynAb 2 or bispecific SynAb 13 followed by incubation with PE-labeled anti-IgG Fc antibody. PE fluorescence was measured by flow cytometry. B Cytotoxicity assay of SynAb 2 and bispecific SynAb 13. HCC1954 (HER2+CD3–) cells alone or HCC1954/T cell cocultures (E:T ratio of 10:1) were either not treated or incubated with 500 ng/mL (3.4 nM) SynAb 2 or 500 ng/mL (3.4 nM) bispecific SynAb 13. HCC1954 viability was assessed by CellTiter-Glo at 48 h following treatment. Data from three biologically independent experiments (three different blood donors) with three replicates each. C Cytotoxicity dose–response curve of bispecific SynAb 13. HCC1954/T cell cocultures (E:T ratio of 10:1) were incubated with varying concentrations of bispecific SynAb 13 (serial dilutions ranging from 0.005 to 500 ng/mL, 0.034 pM to 3.4 nM). HCC1954 viability was assessed by CellTiter-Glo at 48 h following treatment. Data from three biologically independent experiments (three different blood donors) with three replicates each. D Induction of IFN-γ production by bispecific SynAb 13. T cells alone, HCC1954 (HER2+CD3–) cells alone, or HCC1954/T cell cocultures (E:T ratio of 10:1) were either not treated or treated with 500 ng/mL (3.4 nM) SynAb 2 or 500 ng/mL (3.4 nM) bispecific SynAb 13. Culture supernatant IFN-γ was quantified by ELISA at 48 h following treatment. Data from three biologically independent experiments (three different blood donors) with three replicates each. Data represented as means + SEM. For statistical analysis, two-way ANOVA was used followed by posthoc Tukey’s honestly significant difference multiple comparisons test with multiplicity-adjusted P values with α = 0.05. ****P < 0.0001. Curves in C fitted with nonlinear regression model “Sigmoidal, 4PL, X is log(concentration)”.

