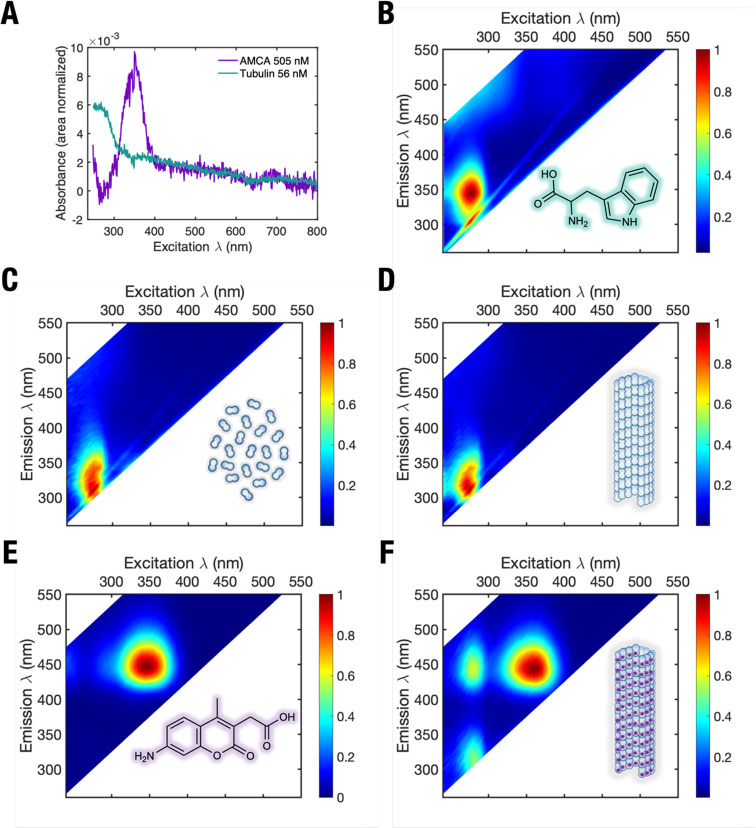
Figure 2.
Steady-state spectra of tubulin and microtubules. (A) Absorbance spectra of free tubulin (teal) and free AMCA (purple) in solution. Intensity normalized fluorescence spectra of (B), free DL tryptophan in solution showing highest fluorescence emission at excitation wavelengths between 270 and 300 nm. (C) Unpolymerized GTP-tubulin, (D) microtubules polymerized using GTP-tubulin, (E) free AMCA, and (F) microtubules polymerized using AMCA-labeled GTP-tubulin. An energy transfer peak not observed in Figure 1A,B (at excitation 280–300 nm, and emission at 420–450 nm) is clearly visible. Colors represent photoluminescence intensity.

