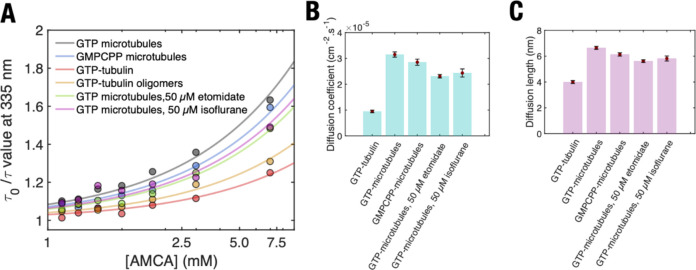
Figure 5.
Parameters extracted from Stern–Volmer analysis to estimate extent of diffusion . (A) Stern–Volmer plot for fitting different tubulin polymers with the static quenching model as shown in main text. Lines represent line of best fit to data points shown in the scatterplot. Note the use of a logarithmic scale for the x-axis. (B) Diffusion coefficients and (C) diffusion lengths of tryptophan excitation in different tubulin polymerization states. Data are shown in Table S5. The errors associated with (B) are standard errors for the fit to determine the diffusion coefficient. The error bars associated with (C) are calculated after propagating errors from experimental values included in eqs 1 and 2.

