
Figure S1.
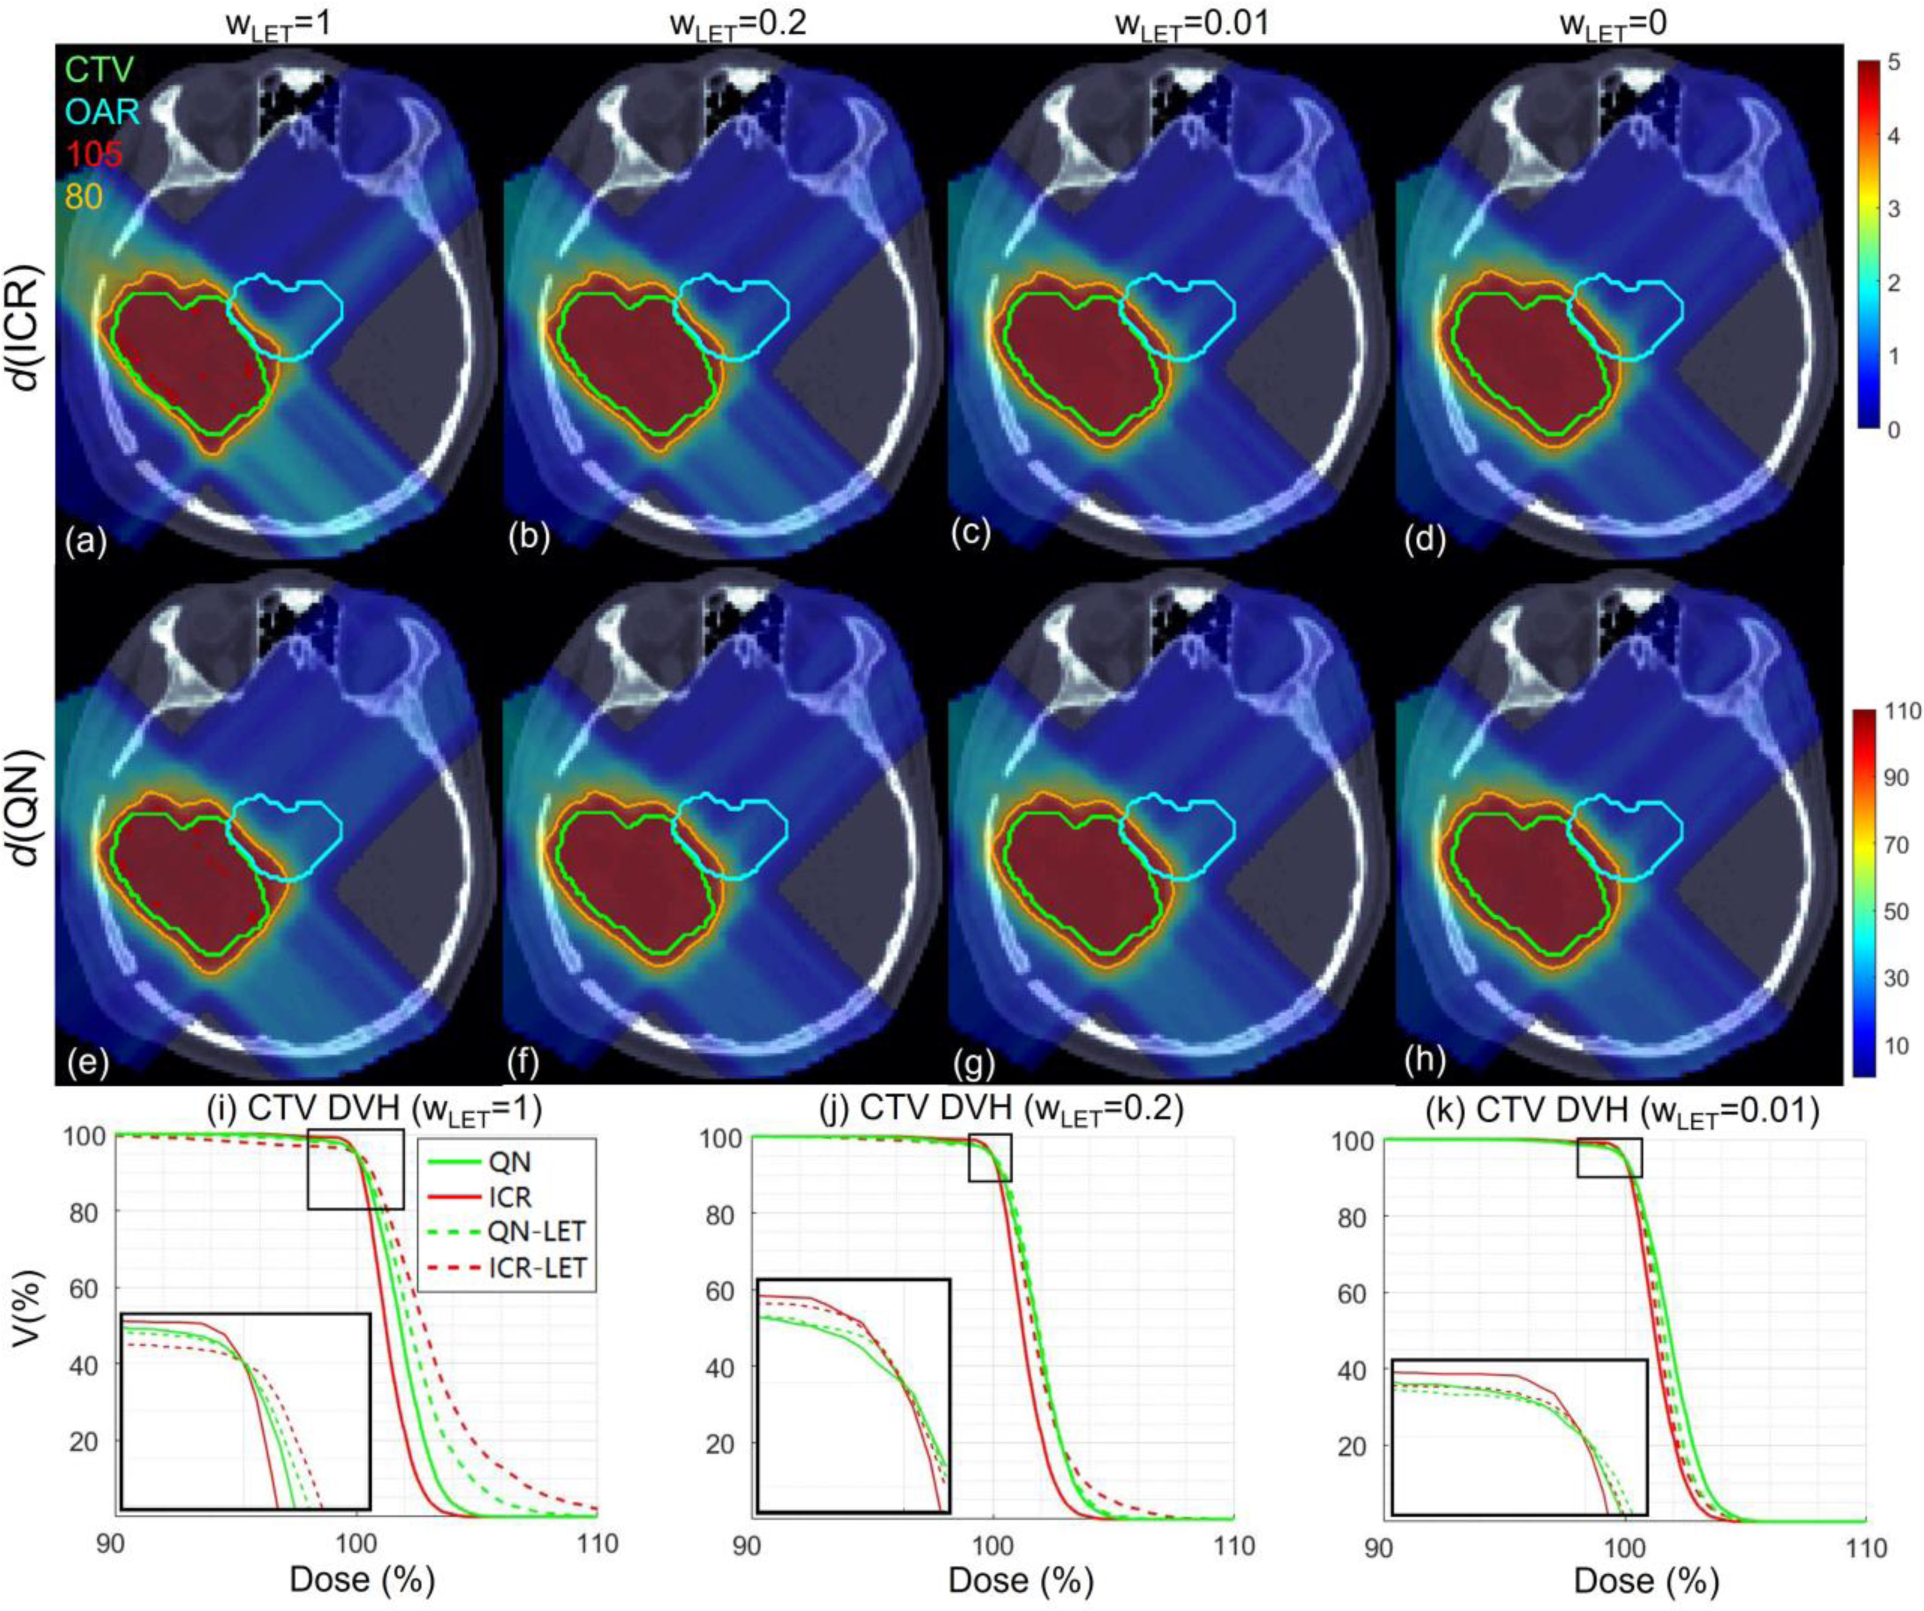
Target dose distribution under different LET objective weighting . Dose plots (a-h): the 1st and 2nd rows correspond to ICR and QN respectively; the 1st, 2nd, 3rd and 4th columns correspond to dose for , and 0 respectively. DVH of CTV plots (i-k) for , and 0.01 respectively. The display window for is [0%, 110%] of prescription dose, and iso-dose lines of 105% and 80% are highlighted in (a-h).