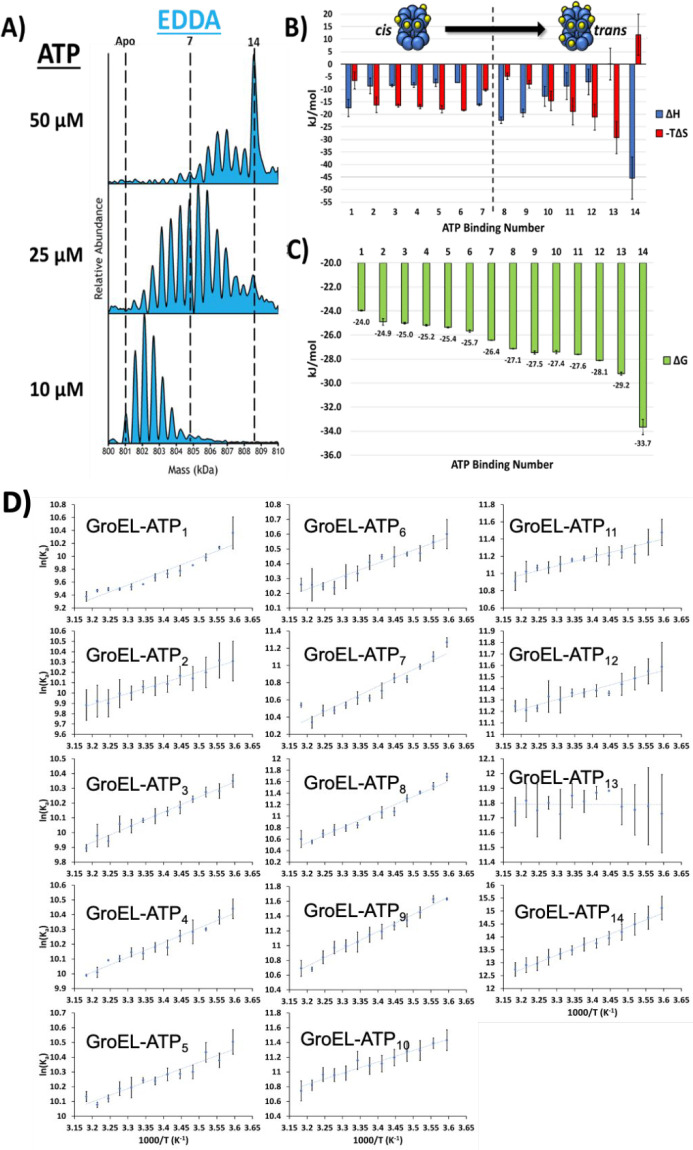
Figure 2.
(A) Deconvoluted spectra showing the effects of increasing ATP concentration. (B) Histograms showing enthalpies (ΔH) and entropies (−TΔS) for the individual ATP binding reactions at 25 °C. The observed EEC for the first seven binding reactions is quite different from that for binding of eight to 14 ATPs, which is consistent with filling of the cis ring prior to binding to the trans ring. Note also that EEC is drastically different for addition of the 13th and 14th ATP cofactors. These observed changes in EEC are indicative of substantial structural changes in the GroEL complex. (C) Overall changes in ΔG associated with the 14 ATP binding reactions. All error bars are standard deviations of three replicates. (D) Van’t Hoff plots (ln Kavs 1000/T) for GroEL–ATPn binding in 200 mM EDDA.

