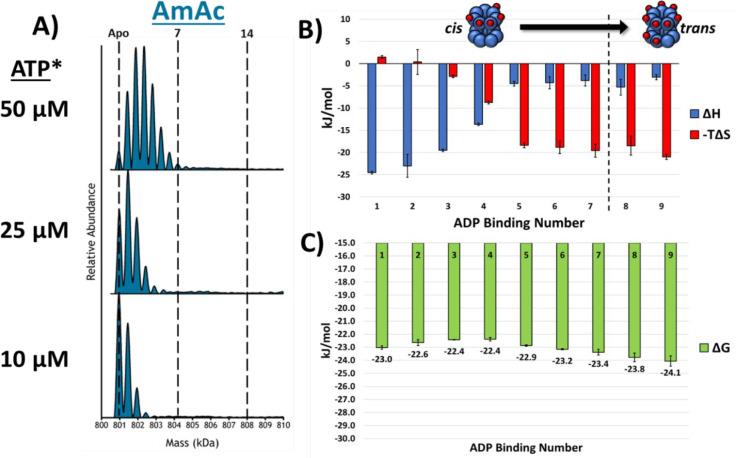
Figure 4.
(A) Stacked deconvoluted spectra showing that as the ADP concentration is increased, the binding of ADP does not show any cooperativity. (B) Bar chart showing the ΔH and −TΔS contributions at 25 °C for each of the ADP binding reactions. The enthalpy and entropy show a singular transition from GroEL–ADP4–5 and are overall much less dynamic than those for the binding of ATP in EDDA. (C) Bar chart displaying the Gibbs free energy measurements for the ADP binding reactions at 25 °C. EEC is more heavily present in the ADP data set, as the Gibbs free energy varies by less than 2 kJ/mol. All error bars are standard deviations of at least three replicates. *ATP was added to the solution, but only ADP binding was observed.

