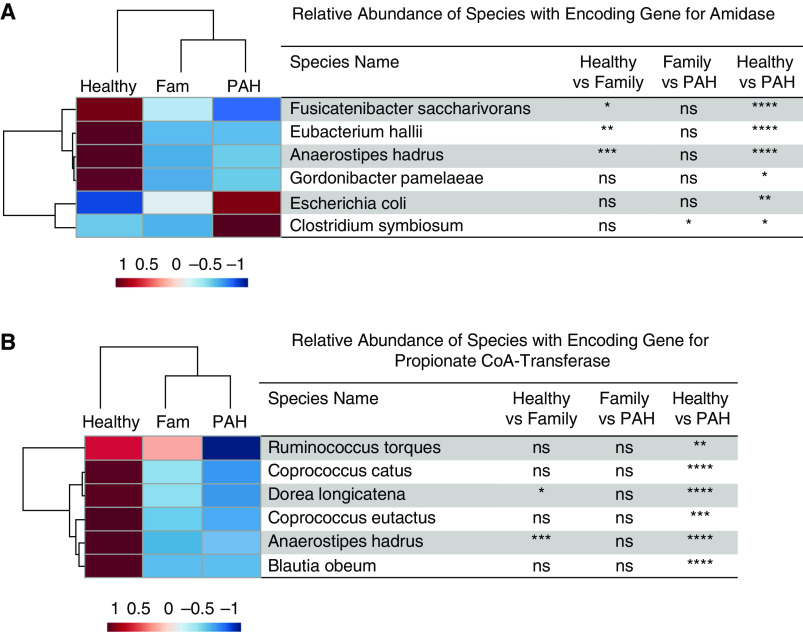
Figure 7.
(A and B) Hierarchical cluster analysis of the relative abundance of species with the encoding genes for (A) amidase (an enzyme involved in the production of valerate and propionic acid) and (B) propionate CoA transferase (an enzyme involved in acetate production). The heatmap displays the group averages of relative abundances of species for each group. The P values were generated by comparing the relative abundances of the species among the groups using one-way ANOVA with a Tukey post hoc analysis to correct for multiple comparisons or a Kruskal-Wallis test with Dunn’s multiple-comparisons test. *P < 0.05, **P ⩽ 0.01, ***P ⩽ 0.001, and ****P ⩽ 0.0001. CoA = coenzyme A; Fam = family; ns = not significant (P ≥ 0.05); PAH = pulmonary arterial hypertension.

