Figure 2.
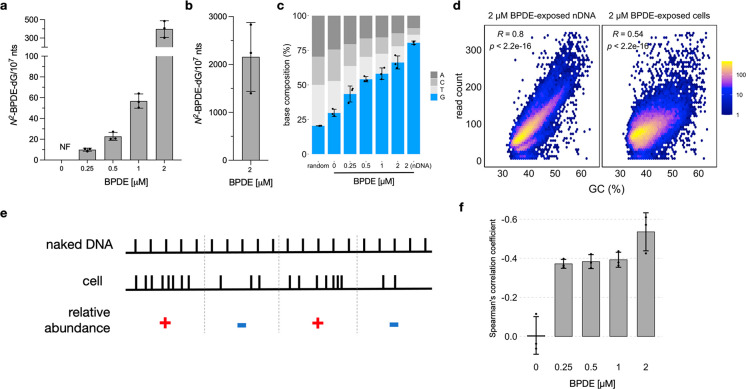
N2-BPDE-dG quantification and sequencing. Results shown are calculated across three biological replicates ± SD (a) N2-BPDE-dG levels in BEAS-2B cells exposed to increasing concentrations of BPDE. (b) N2-BPDE-dG in naked DNA (nDNA) reacted with 2 μM BPDE. (c) Base composition at damage sites. Random values were calculated from three simulated data sets; each contains 10 million random reads across the human genome. (d) Scatter plot showing sequencing read distribution and its Spearman’s correlation coefficient with GC content for nDNA reacted with 2 μM BPDE or cells exposed to 2 μM BPDE. Results were calculated in 100 kb bins across the genome, averaged across three biological replicates. (e) Conceptual visualization of the relative abundance variable evaluated in this study. (f) Bar plots showing the correlation between relative abundance of N2-BPDE-dG and GC-content.

