Figure 3.
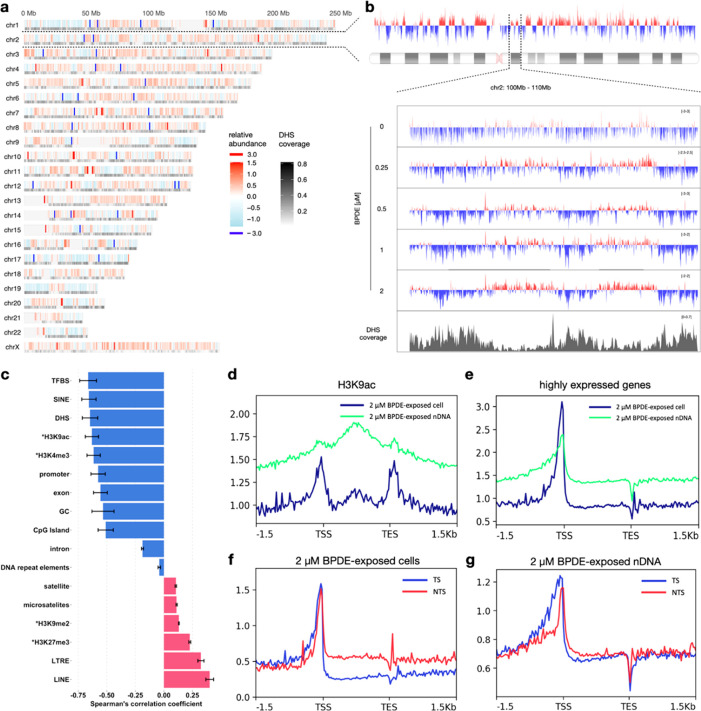
Distribution of N2-BPDE-dG in genomic DNA. (a) Genome-wide map of N2-BPDE-dG in cells exposed to 2 μM BPDE. Relative abundance of N2-BPDE-dG is shown as a function of genomic location. Color scale represents the mean of relative abundance (log2 (Cell/nDNA)) of N2-BPDE-dG calculated in 100 kb bins across three biological replicates. Grayscale represents the DHS coverage in 100 kb bins across genome. Undefined sequences in the human genome annotated in the ENCODE Blacklist,35 such as centromeres and telomeres, were removed from the data and are shown in light gray. (b) Detailed profile of the relative abundance of N2-BPDE-dG on chromosome 2; the view is further expanded at 100–110 Mb for each exposure condition. Y-axis represents relative abundance of N2-BPDE-dG. Data shown are the average of three biological replicates (calculations performed with 5 kb bins across chromosome 2). The plots were smoothed using LOESS (locally estimated scatterplot smoothing). (c) Spearman’s correlation coefficients of relative abundance of N2-BPDE-dG and genomic features in cells exposed to 2 μM BPDE. Calculations were performed with 100 kb bins across the genome, averaged across three biological replicates ± SD. *ChIP-seq data for BEAS-2B cells were previously published.29,34,36−38 (d, e) Profiles of N2-BPDE-dG in H3K9ac and highly expressed gene regions (n = 10,612) from cells and nDNA reacted with 2 μM BPDE. Calculations were performed in 25 bp bins and averaged across three biological replicates. (f, g) Profiles of N2-BPDE on the transcribed strand (TS) or nontranscribed strand (NTS) of highly expressed genes (n = 10,612). Shown are data for cells (f) and nDNA (g) exposed to 2 μM BPDE. Highly expressed genes were defined using mRNA-seq data acquired in this study (see RNA-sequencing and data processing in Methods section in Supporting Information). Data represent mean values calculated from three replicates in 25 bp bin size.

