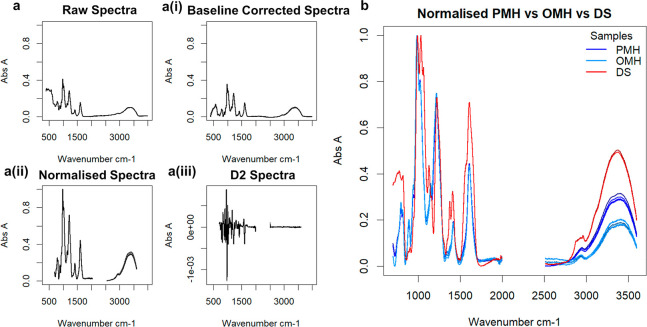
Figure 1.
(a) Steps in the ATR-FTIR spectral preparation following recording on a dry sample of pharmaceutical heparin. (a) (i) The raw spectrum of a randomly selected heparin sample. (ii) Baseline-corrected (seventh-order polynomial) spectrum. (iii) Spectrum following normalization and removal of variable regions <700, >3600, and between 2000 and 2500 cm–1. (iii) The second derivative of the resultant spectrum. (b) Normalized ATR-FTIR spectra of samples of PMH, OMH, and DS (700–3600 cm–1) showing similarity between PMH and OMH spectra in the regions 700–2000 cm–1, differing significantly only in the highly variable O–H stretch region 3000–3500 cm–1. In contrast, DS is distinct from either PMH or OMH in the region 700–2000 cm–1, corresponding to structural variations.

