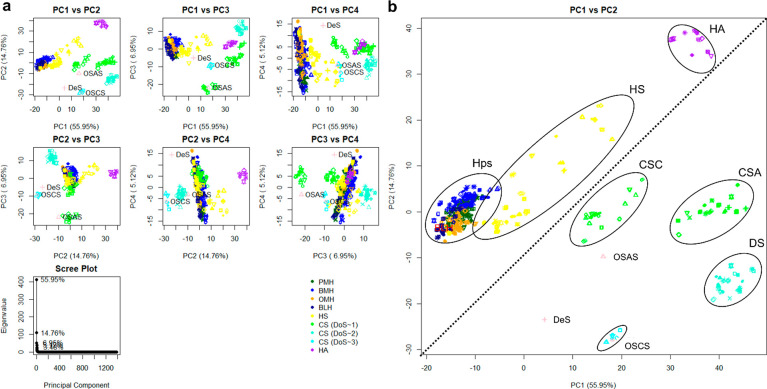
Figure 2.
(a) PCA scores and scree plot(s) for different GAG families. At least two components are needed to separate the samples into family groups, indicating that earlier components appear to separate by gross structure, while later components separate by unique constituents. (b) Score plot for PC1 versus PC2. Glycosaminoglycan families are highlighted to show groupings, and the plot is split in half diagonally to distinguish different glycosidic bond types (β 1–4 upper left vs β 1–3/4 lower right). In all plots, 176 heparins, comprising 69 PMH (dark green), 55 BMH (blue), 33 OMH (orange), 19 BLH (dark blue), 31 HS (orange), 50 chondroitins (including 13 CS-A samples, 16 CS-C samples, and 21 DS (green for monosulfated chondroitin samples and teal for disulfated chondroitin samples)), 11 HA (purple), and 6 OSCS (including the OSCS selected for the contamination study later (aquamarine)) samples, as well as an OSAS and DeS sample, also used in the contamination study are compared. All five repeats of each sample are shown, and the polysaccharides selected for the contamination study are highlighted in lilac. The ellipses are for illustrative purposes only.

