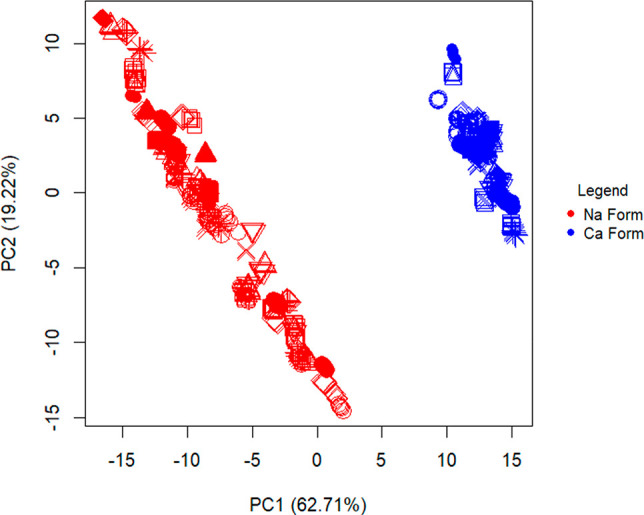
Figure 5.

PCA score plots of FTIR-ATR spectra of sodium vs calcium heparins. Samples of commercial heparins bound to different cation forms. All five repeats of 69 sodium heparins (red) and 36 calcium heparins (blue) were compared using PCA, displaying clear separation between the two.
