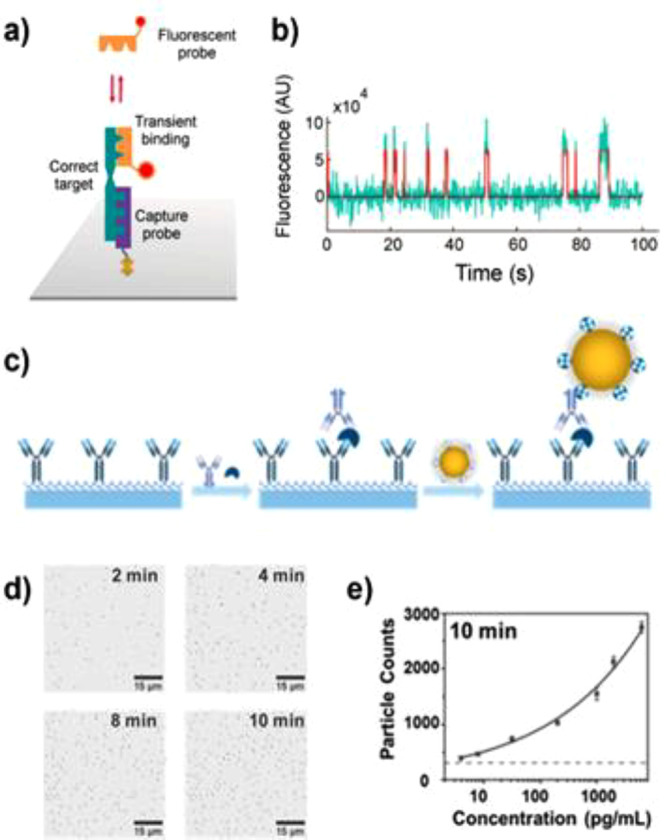
Figure 3.

(a) Schematic representation of single molecule recognition through equilibrium Poisson sampling (SiMREPS). (b) Representative intensity versus time traces in the absence and presence of adenosine (50 pM). Reproduced with permission from (39). Copyright 2020 American Chemical Society. (c) Illustration of one-step process for forming the human PCT antibody–antigen–antibody sandwich complexes. (d) Bright-field images (part of entire view) over time for digital counting. (e) Standard curve of PCT detection at 10 min. The error bars are the standard deviation of triplicate tests, and the dashed line represents the level of blank. Reproduced with permission from (47). Copyright 2020 American Chemical Society.
