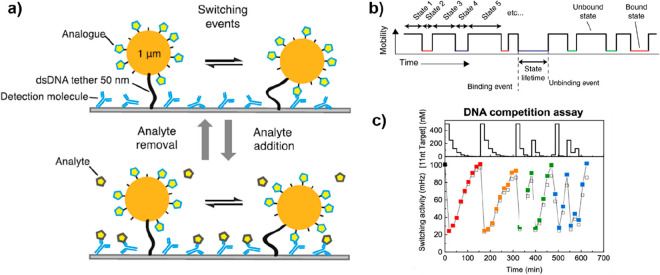
Figure 4.
Design of a digital single-particle sensor. (a) Schematic drawing of continuous molecule monitoring with a digital single-particle switch (the molecules are not to scale). The sensing functionality is embedded in the digital switching behavior of the particle. The particle dynamically switches between bound and unbound states because of transient binding between the detection molecule and analogues. Reproduced with permission from (54). Copyright 2020 American Chemical Society. (b) The mobility of the particles is analyzed as a function of time, and the binding/unbinding events are digitally detected for hundreds of particles in parallel. The time between two consecutive events corresponds to the lifetime of the enclosed state. Reprinted with permission from ref (51). Copyright 2018 Nature Portfolio. (c) An example of switching activity measured over time for an ssDNA analyte. The top panel shows the concentration–time profiles, and the bottom panel shows the measured switching activity. The switching activity shows an inverted response (high analyte concentration gives low switching activity), as expected for a competitive assay. Red and orange data points represent equal decreasing concentration series; green and blue data points represent sequences of alternating concentration values. Lines are guides for the eyes. Reproduced with permission from ref (55). Copyright 2020 American Chemical Society.

