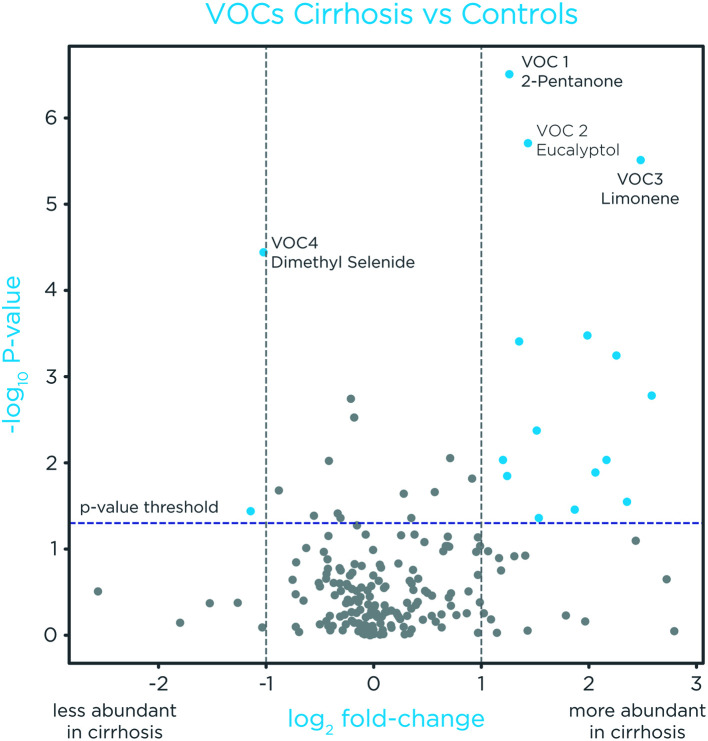
Fig. 1. Volcano plot of exhaled VOCs.
The X-axis represents the log2 mean ratio fold-change of the relative abundance of each VOC between cirrhosis and controls. The Y-axis represents the p-value of each VOC. Compounds with fold-change >2 and p<0.05 are highlighted in blue. Limonene and 2-pentanone were elevated in the breath of patients with cirrhosis and dimethyl selenide was reduced, as expected. VOC, volatile organic compound.

