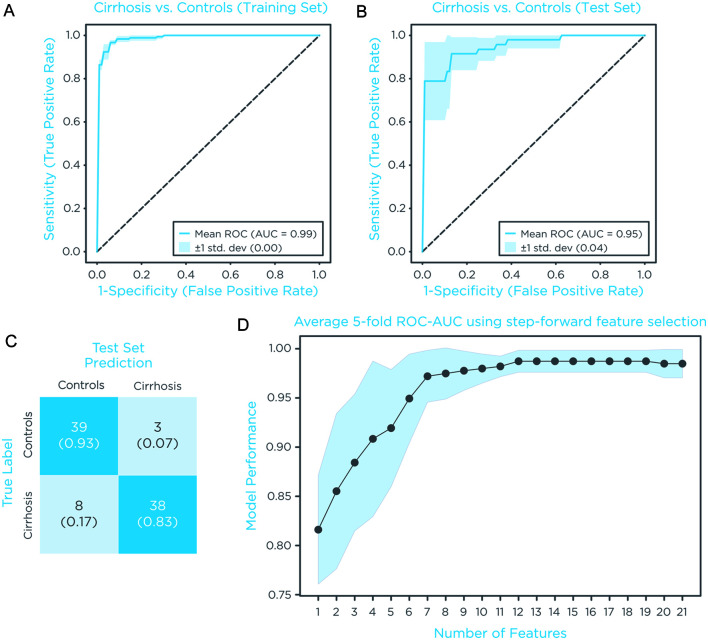
Fig. 4. Classification performance of combined VOCs.
(A) ROC plot and confidence interval obtained for the training set. (B) ROC plot and confidence interval obtained for the test set. (C) Corresponding confusion matrix generated using the Youden index as threshold. (D) Improvements of classification performance by addition of VOCs to the model. ROC, receiver operating characteristic; VOCs, volatile organic compounds.

