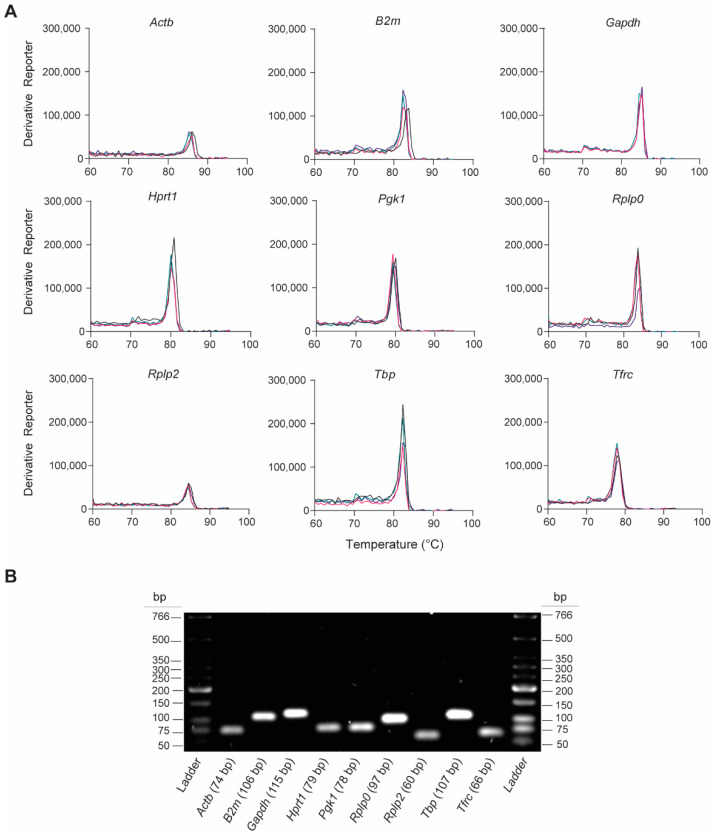
Figure 2.
Validation of RT-qPCR primer specificity for the nine candidate rat-specific HKGs. (A) Representative melting curves obtained from qPCRs reactions, which show the peak of DNA dissociation for each HKG in lung tissue 6 h post-injury; n = 4 individual melting curves. (B) Representative image of a 2% agarose gel electrophoresis containing PCR amplicon products (7.5 µL/lane) obtained after RT-qPCR.

