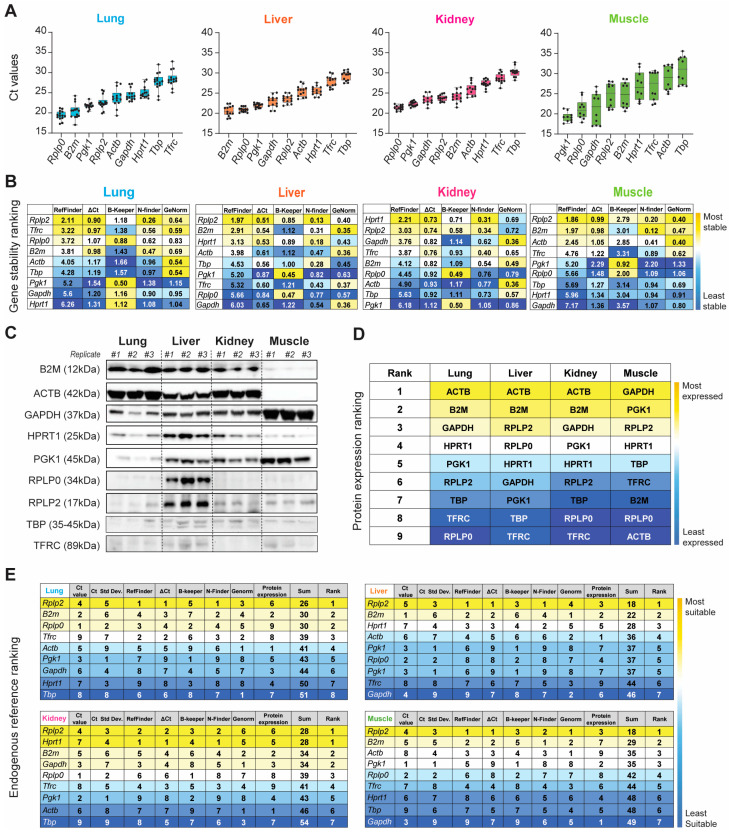
Figure 3.
Evaluation of gene expression, stability, and translation of the nine HKGs between the lung, liver, kidney, and muscle tissue in naïve rats. (A) Ascending order distribution of the raw mean Ct values of the nine HKGs (n ≥ 10). Error bars represent the standard deviation of the mean. (B) Heatmaps representing the gene stability rankings obtained with RefFinder, Delta Ct (ΔCt), BestKeeper (B-Keeper), NormFinder (N-finder), and GeNorm for the nine HKGs. The color scale represents the most stable gene (yellow) to the least stable gene (blue; n ≥ 10 rats). (C) Representative Immunoblots against the 9 HKGs obtained with 15 µg of total protein loaded. (n = 3 biological replicates indicated as #1, #2, and #3). (D) Protein expression ranking for the nine HKGs. The color scale represents the most (yellow) to the least (blue) abundant protein expression. Results extrapolated from immunoblots presented in naïve. (E) Ranking of the nine HKGs according to their Ct value, Ct value standard deviation, gene stability from the five algorithms, and protein expression level. The color scale represents the most (yellow) to the least (blue) suitable endogenous reference.

