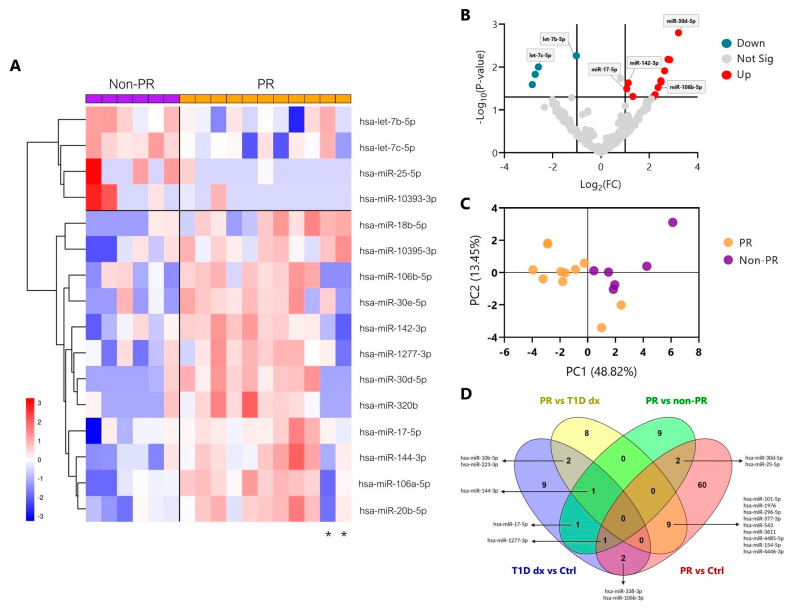
Figure 1.
Distinct miRNA signature in plasma during the partial remission phase of T1D in pediatric patients. (A) Hierarchical clustering heatmap showing the 16 miRNAs with significantly different expression levels (DEMs) in plasma among pediatric patients with T1D in remission (PR, orange) and without remission (non-PR, violet) from the discovery cohort. Each column represents individual samples, and each row represents an individual miRNA. Upregulated miRNAs are shown in red, and downregulated miRNAs are shown in blue. An asterisk below two patients in PR marks their different miRNA expression patterns compared to other remitters. (B) Volcano plot showing changes in miRNA levels between pediatric patients with T1D in remission and without remission. Lines indicate log(FC) (x−axis) and p-value (y−axis) cut-offs. Blue and red dots indicate significantly downregulated and upregulated miRNAs during PR, respectively, and grey dots indicate non-significantly different expression levels of miRNAs. (A,B) Log(FC) > 1 for upregulated DEMs, and log(FC) < 1 for downregulated DEMs. p-value < 0.05 by moderated t-test; n = 6–11. (C) Principal component analysis plot of the 16 DEMs. Each dot represents a sample. Orange: remitter patients (n = 11); violet: non-remitter patients (n = 6). (D) Venn diagrams showing overlapping DEMs with validated target genes between different comparisons (PR vs. non-PR; PR vs. controls (Ctrl); PR vs. T1D diagnosis (dx), T1D diagnosis vs. controls).

