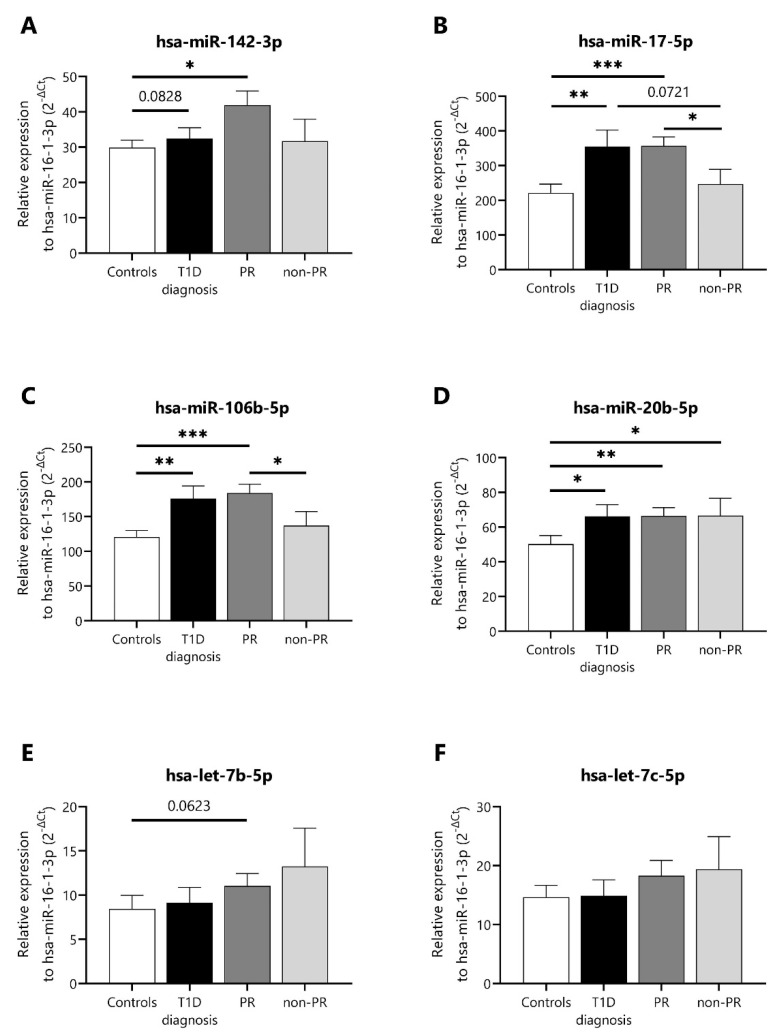
Figure 2.
Differentially expressed miRNAs in plasma of T1D patients at different stages and non-diabetic control subjects. (A–F) Single-assay RT-qPCR validation of some differentially expressed miRNAs in plasma samples of controls (n = 15), newly diagnosed patients with T1D (n = 8), remitter patients (PR, n = 10), and non-remitter patients (non-PR, n = 9) from the validation cohort. The miRNA expression signal was normalized to hsa-miR-16-1-3p expression. Values are expressed as 2-∆Ct. Data are presented as mean ± SEM. * p ≤ 0.05, ** p ≤ 0.01, *** p ≤ 0.001, Kruskal–Wallis with Dunn’s post hoc test.

