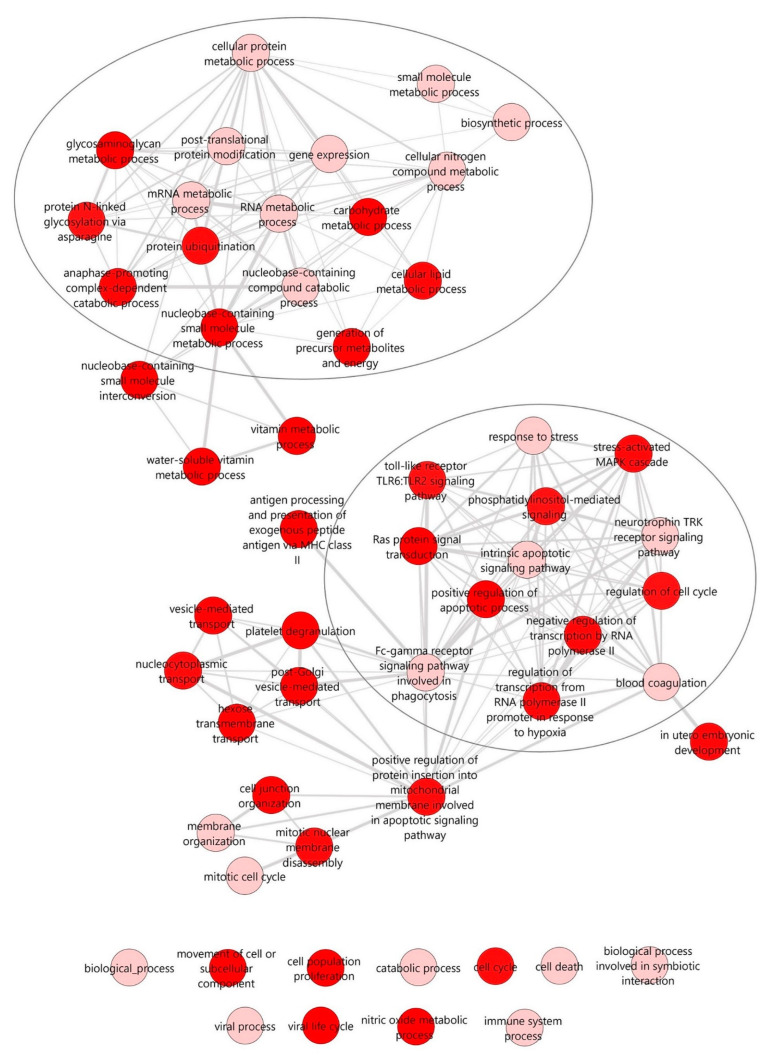
Figure 3.
Interactive graph of the enriched GO terms for the selected miRNAs. The interactive graph was generated using the web tool REVIGO (http://revigo.irb.hr/, accessed on 21 January 2022), which plots the remaining relevant GO terms (after reducing redundancy) for the 14 DEMs with validated target genes that were retrieved from the DIANA-miRPath v3 (http://www.microrna.gr/miRPathv3, accessed on 21 January 2022) web server using the TarBase v7 database. Highly similar GO terms are linked by edges in the graph, where the line width indicates the degree of similarity. The bubble color indicates the provided p-value for the FDR (q-value). Darker red color indicates statistically more significant GO terms. Two main clusters of biological processes were identified: one comprising different signaling pathways related to the immune response, apoptosis, or stress (upper circle) and the other comprising metabolic processes (lower circle).

