Figure 7.
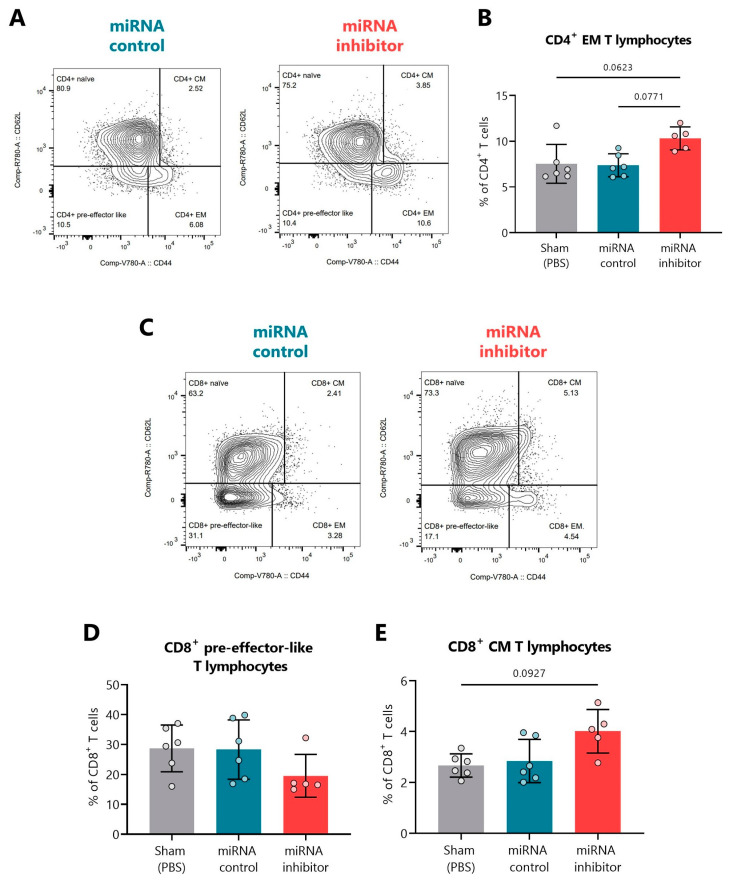
In vivo miR-30d-5p inhibition resulted in T cell subset changes in the pancreatic lymph nodes. (A) Representative FACS plots indicating the percentage of CD4+ naïve, EM, CM, and pre-effector-like T cells in PLN of the control inhibitor (left, blue) and miRNA inhibitor (right, red) treatment groups. (B) Percentage of CD4+ EM T cells in PLN of sham mice (n = 6, left, grey), mice treated with a control inhibitor (n = 6, middle, blue), or mice treated with the miR-30d-5p inhibitor (n = 5, right, red). (C) Representative FACS plots indicating the percentage of CD8+ naïve, EM, CM, and pre-effector-like T cells in PLN of the control inhibitor (left, blue) and miRNA inhibitor (right, red) treatment groups. (D,E) Percentages of (D) CD8+ pre-effector-like T cells or (E) CD8+ CM T cells in PLN of sham mice (n = 6, left, grey), mice treated with a control inhibitor (n = 6, middle, blue) or mice treated with the miR-30d-5p inhibitor (n = 5, right, red). Data are presented as mean ± SD. p-values were determined by Kruskal–Wallis with Dunn’s post hoc test.

