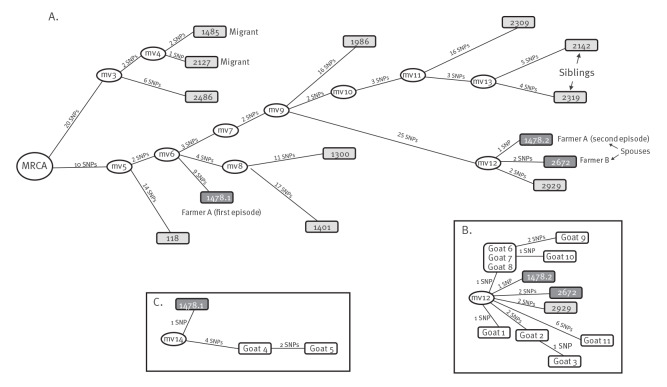
Figure 1.
Network of relationships between the Mycobacterium caprae isolates from human cases, based on whole genome sequence, Almería, 2003–2021 (n = 14)
MRCA: most recent common ancestor; mv: median vector; SNP: single nucleotide polymorphism.
Panel A shows human isolates from Almería; panels B and C show isolates from goats together with those human isolates which were closely related to them.
Numbers in boxes correspond to the isolates’ reference numbers. Dark boxes: farmers; siblings and migrants are specified with labels close to the corresponding box). Ellipses: nodes in the network corresponding to theoretical isolates which were not sampled. Genomic distances (number of SNPs) between the isolates are indicated on the linking lines. Length of the linking lines length are not to scale.

