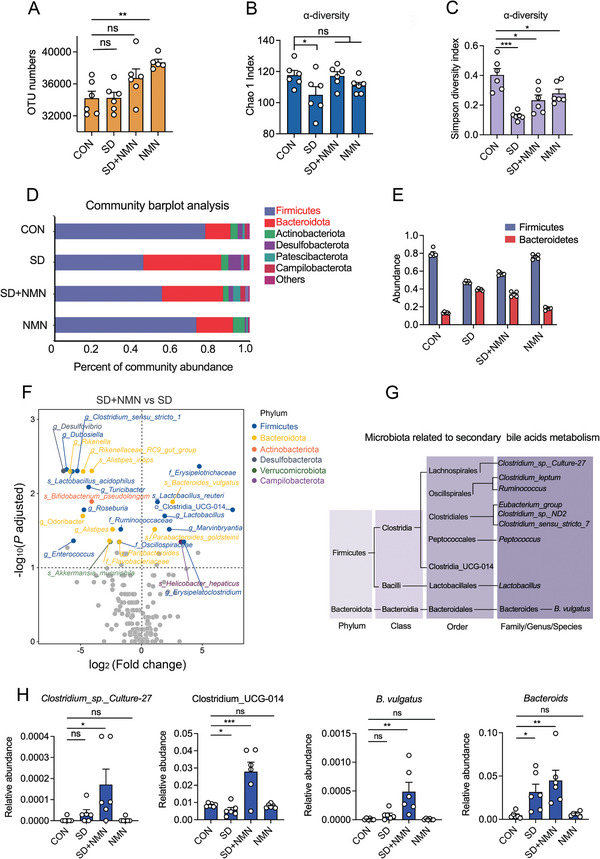
Figure 2.

Microbial diversity analysis of gut microbiota between four groups. A) The number of OTUs in four groups. B,C) Alpha diversity of gut microbiota responses to NMN treatment in SD mice, including B) Chao 1 richness and C) Simpson diversity. Decreased Chao 1 abundance and Simpson diversity index in SD‐treated mice indicated the perturbations in gut microbiota diversity at the OTU level. D) Microbial population distribution in fecal samples at the phylum level. The horizontal axis represents the relative abundance of microbial population and the vertical axis represents samples’ information. E) The abundance of Firmicutes and Bacteroidetes in four groups. It shows a markedly lower ratio of Firmicutes to Bacteroidetes in SD‐treated mice, for the relative abundance of the Firmicutes in SD‐treated mice was lower by 50%, whereas the Bacteroidetes were higher by a corresponding degree. F) Volcano plots of differential bacteria associated with SD + NMN group versus SD group. Significantly up‐ or down‐regulated microbiota flora were colored according to their taxonomy at the phylum level. G) Taxonomic list of gut microbiota in our study that involved in bile acids metabolism, including primary bile acids metabolism and secondary bile acids metabolism. H) The relative abundance of Clostridium_sp._Culture‐27, Clostridium_UCG‐014, Bacteroides vulgatus, and Bacteroids among four groups. Data were presented as mean ± SEM. Statistical significance was determined by unpaired t‐test and denoted as follows: *p < 0.05; **p < 0.01; ***p < 0.001; ns, not significant.
