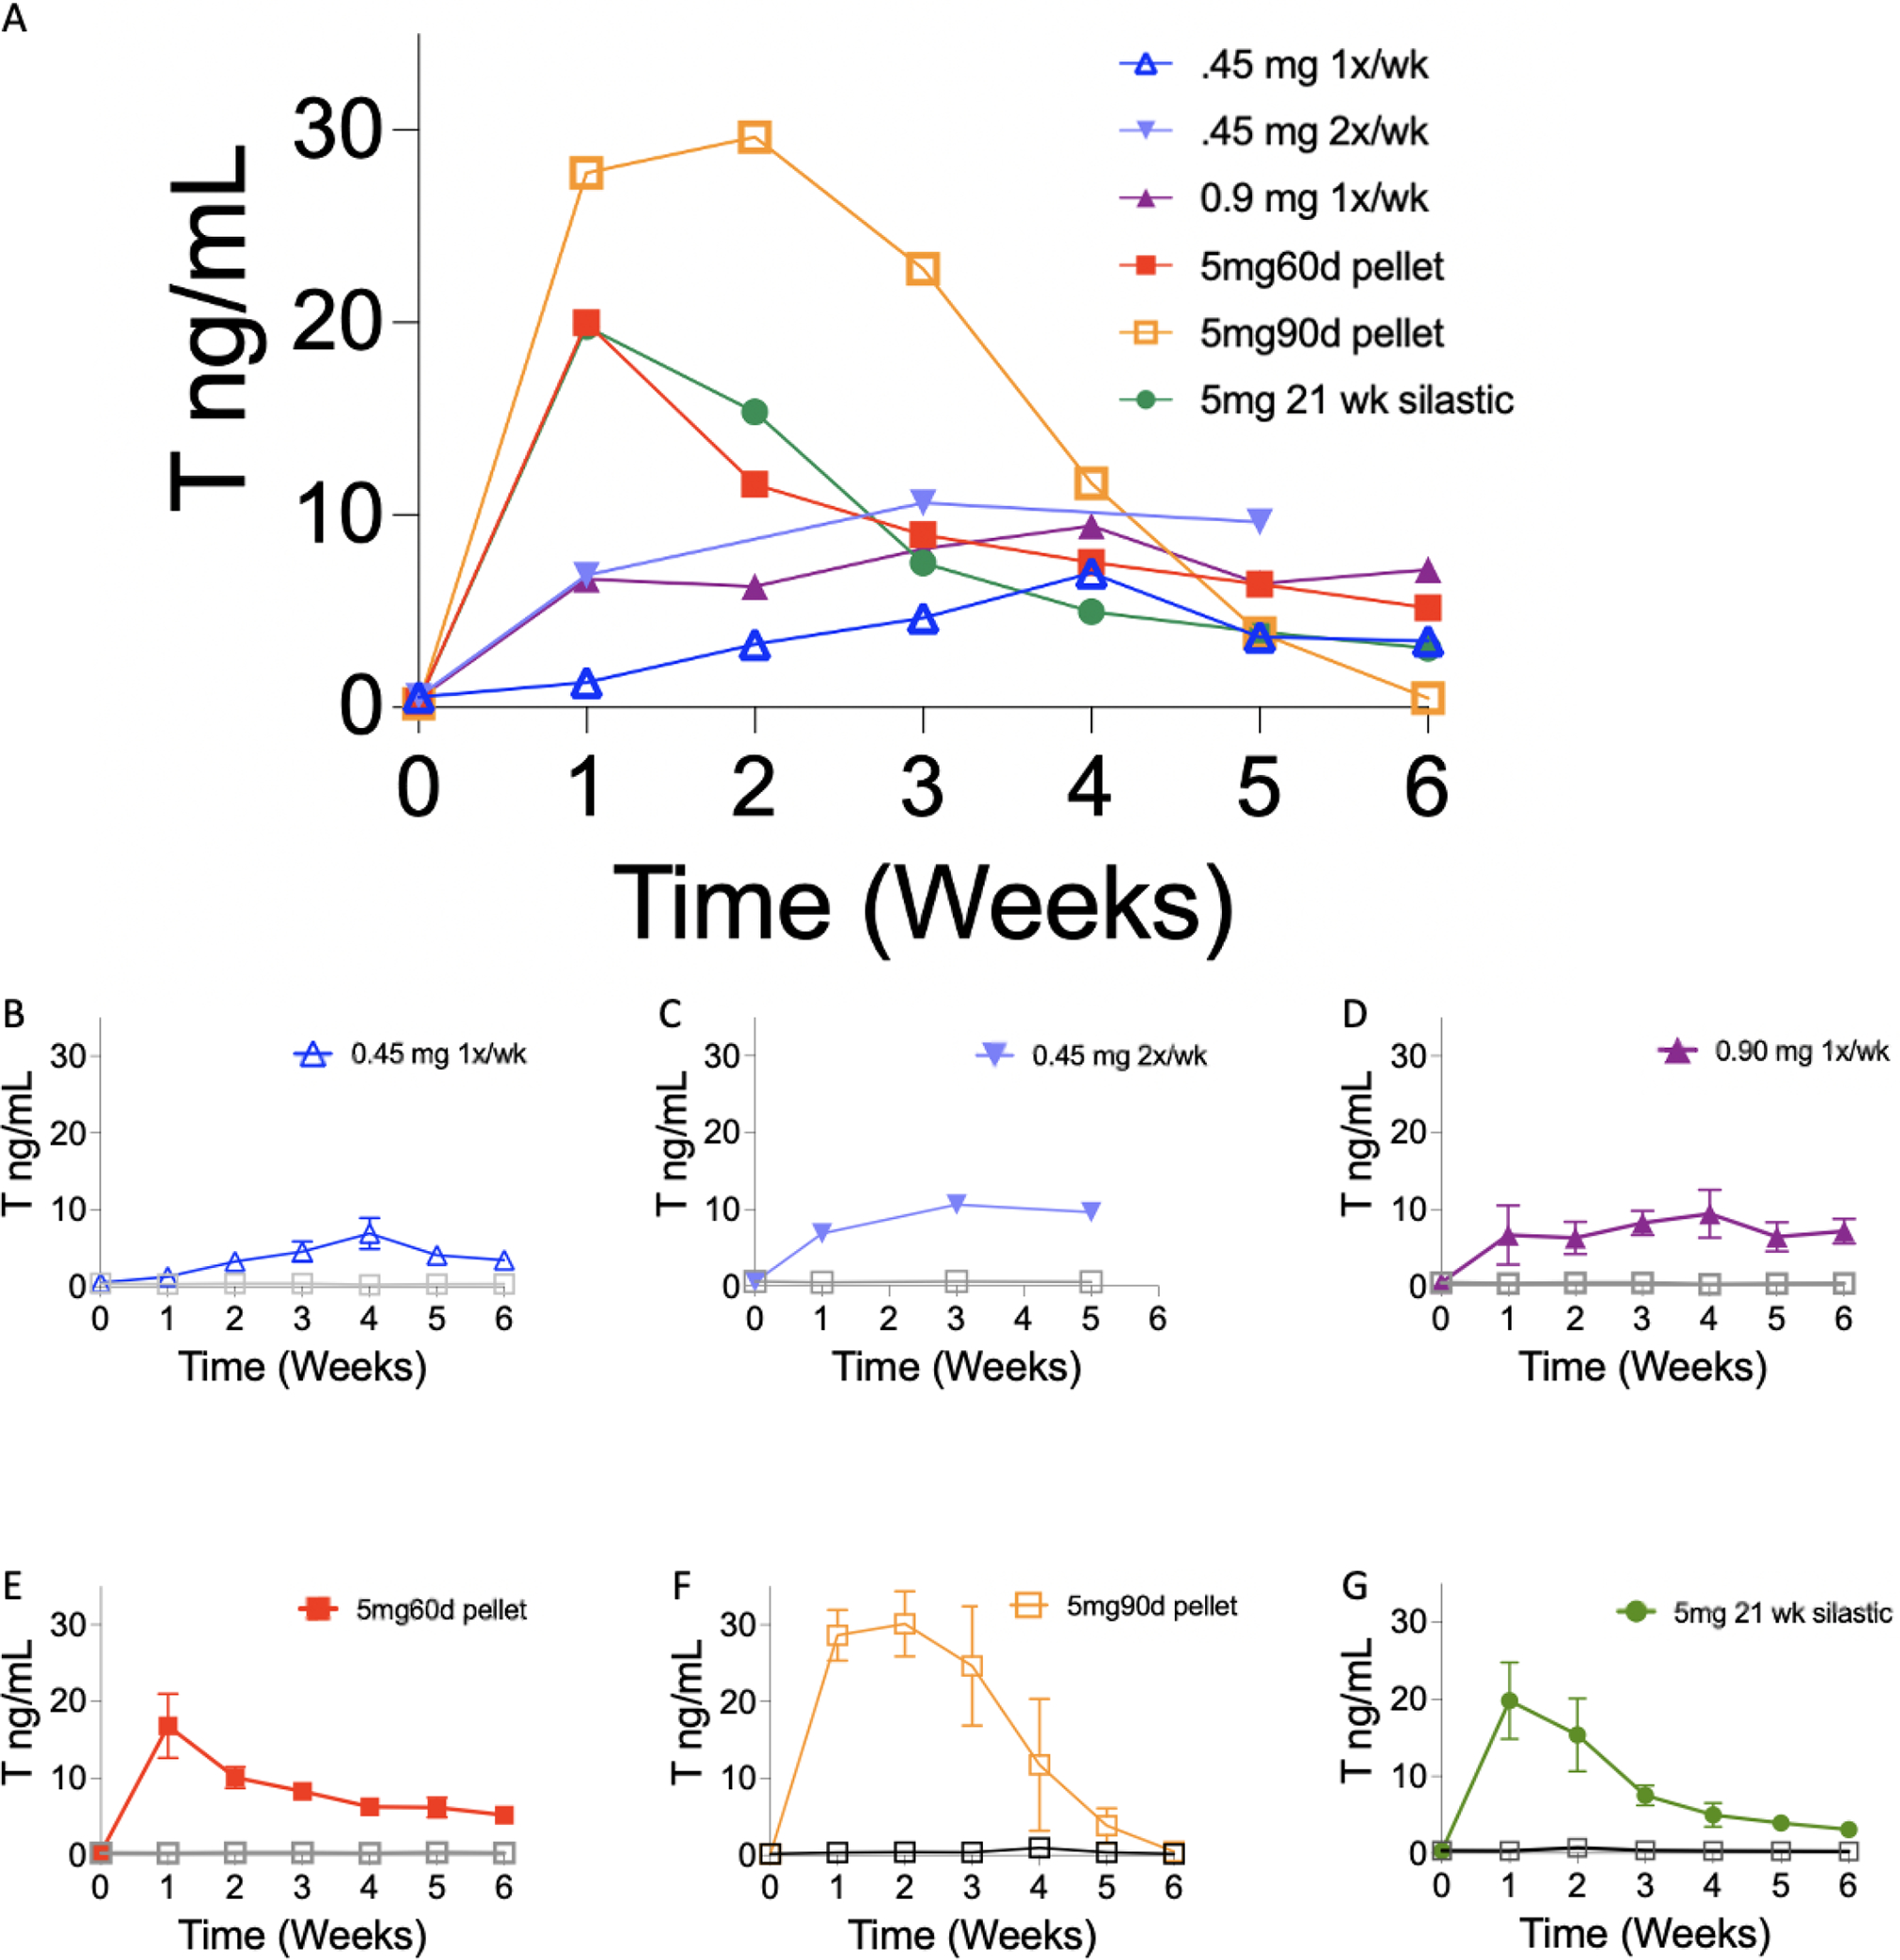
Figure 2.

Longitudinal weekly T enanthate levels (A) Average T levels (ng/mL; mean ± SD) in serum after subcutaneous injections of 0.45 mg once per week (blue; B), 0.45 mg twice per week (light blue; C) 0.90 mg once per week (purple, D), of T enanthate dissolved in sesame oil, subcutaneous implantations of pellets with T enanthate (5mg/pellet, 60-day release, red; E, or 90-day release, orange; F) and silastic tubing loaded with 5mg T enanthate dissolved in sesame oil(green; G) in all cohorts from Week 0 (prior to T treatment) and through 6 weeks of T treatment. (B-G) Individual cohorts of mice. Controls are depicted as gray squares (mean ± SD, error bars that are shorter than symbol are not denoted). T levels for 0.45 mg twice per week (light blue) were measured at week 0 and 1 and subsequently every other week as this study had a long total duration after T cessation as seen in Figure 3.
