
Figure 3.
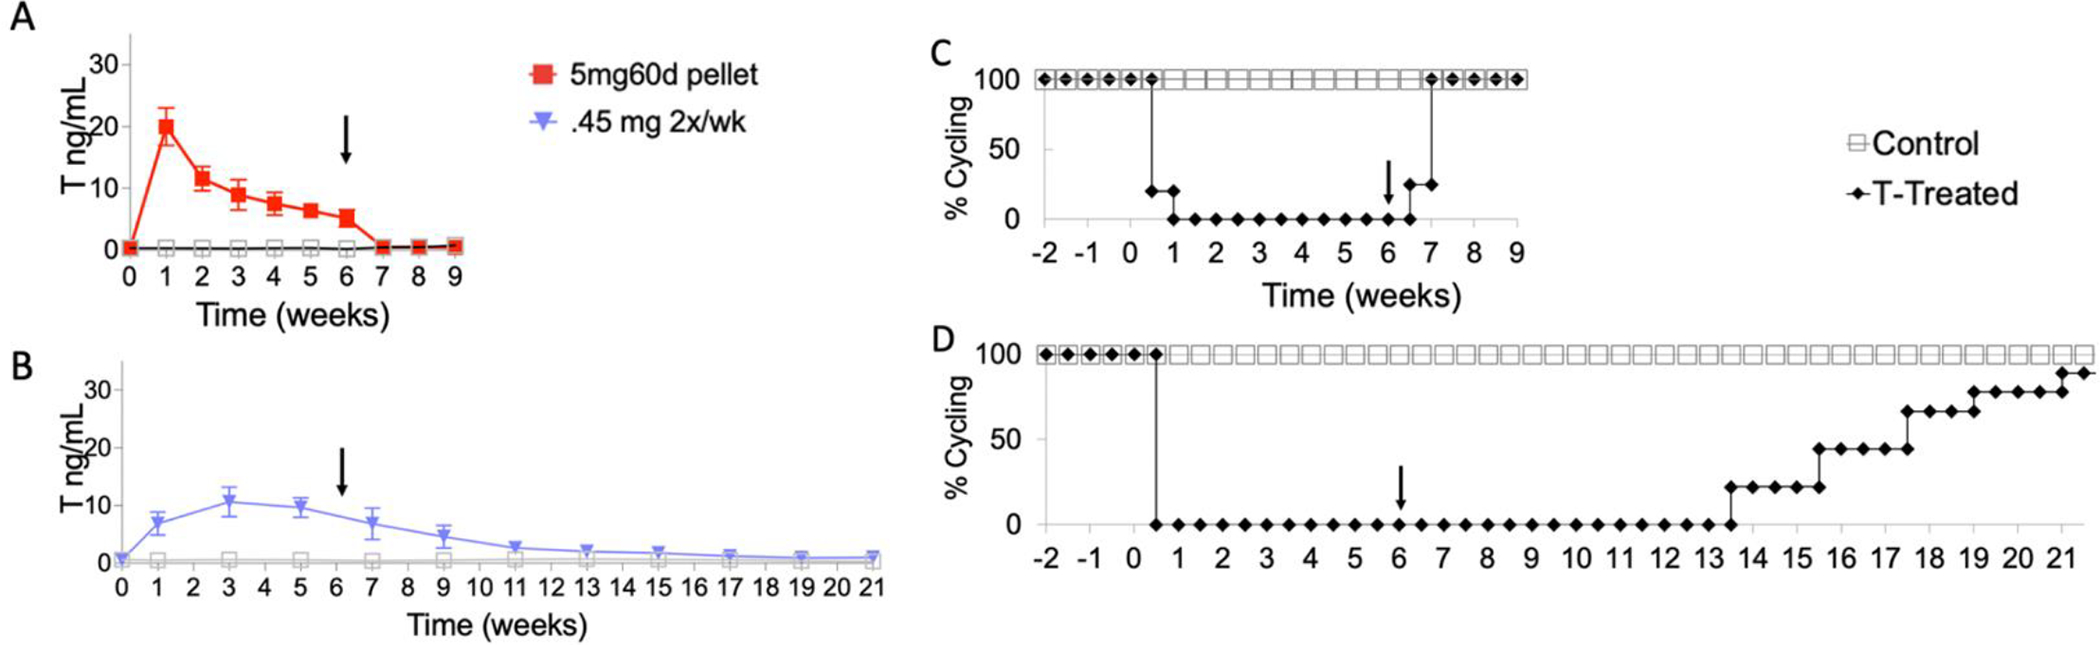
T-Induced changes and reversibility of estrous cycling vary based on administration method. Black arrow points to the end of T administration. T levels are shown are depicted as mean ± SD. Controls are depicted as gray squares. (A) T levels (ng/mL) in female mice treated with a 5mg 60 day release pellet. At pretreatment (Week 0), all mice were comparable to controls. Within one week, T levels rose and were in a physiologically male range until the end of treatment (Week 6). After explantation (Week 6), T levels dropped and were comparable to controls. (B) T levels in female mice receiving 0.45 mg T enanthate, twice per week for 6 weeks. At pretreatment (Week 0), all mice were comparable to controls. Within one week, T levels rose and were in a physiologically male range until the end of treatment (Week 6). T levels subsequently remained elevated until week 21. (C-D) All T treated mice stopped cycling within one week after beginning T treatment and remained in persistent diestrus. (C) 100% of mice treated with the pellet resumed cycling within one week of ending treatment (Week 6). (D) Mice receiving twice weekly injections took 7–16 weeks after ending treatment to resume cycling.