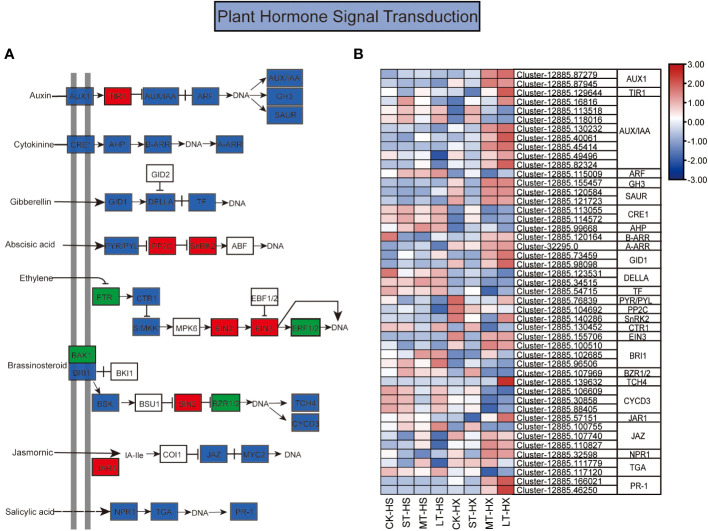
Figure 6.
The KEGG pathway annotation diagram of the plant hormone signal transduction pathway of DEGs. (A) Schematic diagram of the KEGG pathway for the enrichment of DEGs in the plant hormone signal transduction pathway. Red boxes indicate upregulation, green boxes indicate downregulation, and blue boxes indicate both up- and downregulation. (B) Heatmap showing the expression of DEGs associated with different hormones. Box color indicates the expression level of each gene: blue = decreased expression and red = increased expression.

