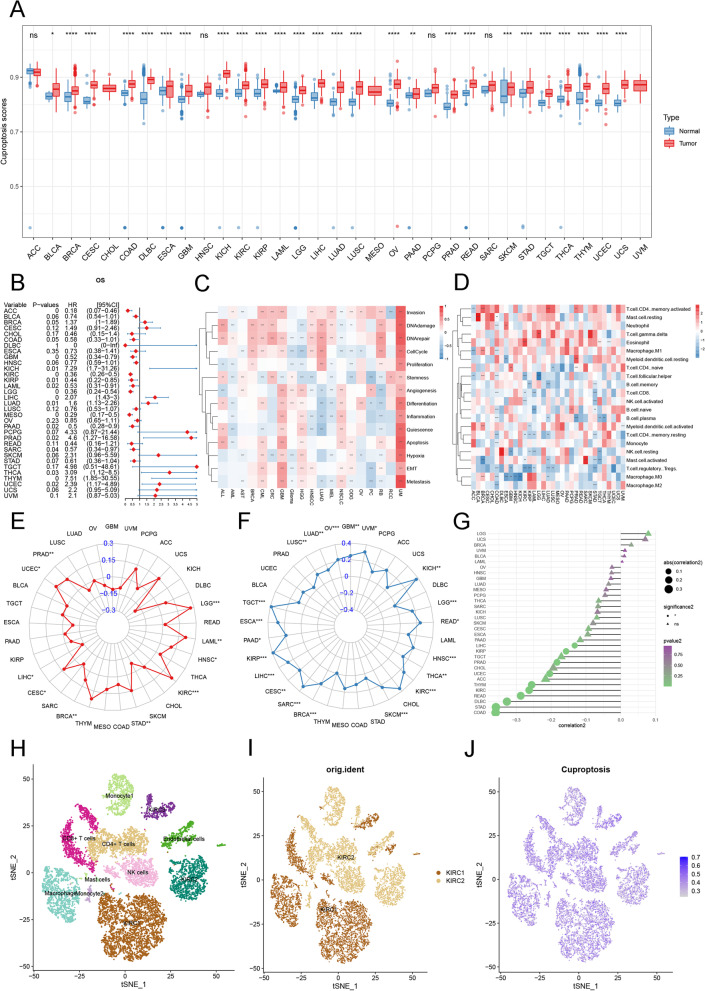
Fig. 2.
Prognostic analysis, pathway scores, and immunological characteristics of cuproptosis. A Combined GTEX and TCGA databases were analyzed for cuproptosis pathway scores. Box lines indicate mean values. B OS forest plot for CS. C Correlation between CS and cell function. The darker the color, the stronger the correlation. *P < .05, **P < .01, ***P < .001. D Correlation analysis of cuproptosis tumor infiltration immune cells. *P < .05, **P < .01, ***P < .001. E The correlation of CRG expression and MSI. The circles greater than 0 indicate that cuproptosis gene expression is positively correlated with MSI, but the circles less than 0 mean the opposite. F TMB score for cuproptosis. The more distant the points and lines spread outward, the higher the correlation score of the associated tumor is. G Correlation of CS with microenvironmental scores. Circles indicate the statistical significance and triangles indicate no statistical significance. Correlation is proportional to the absolute value of the score. H tSEN plot representation of KIRC samples with 11 distinct cell types. I tSEN plot representation of KIRC from two different samples. J Comparison of CSs in different KIRC tumor microenvironment cells. The blue horizontal line on the violin plot indicates the median CS

