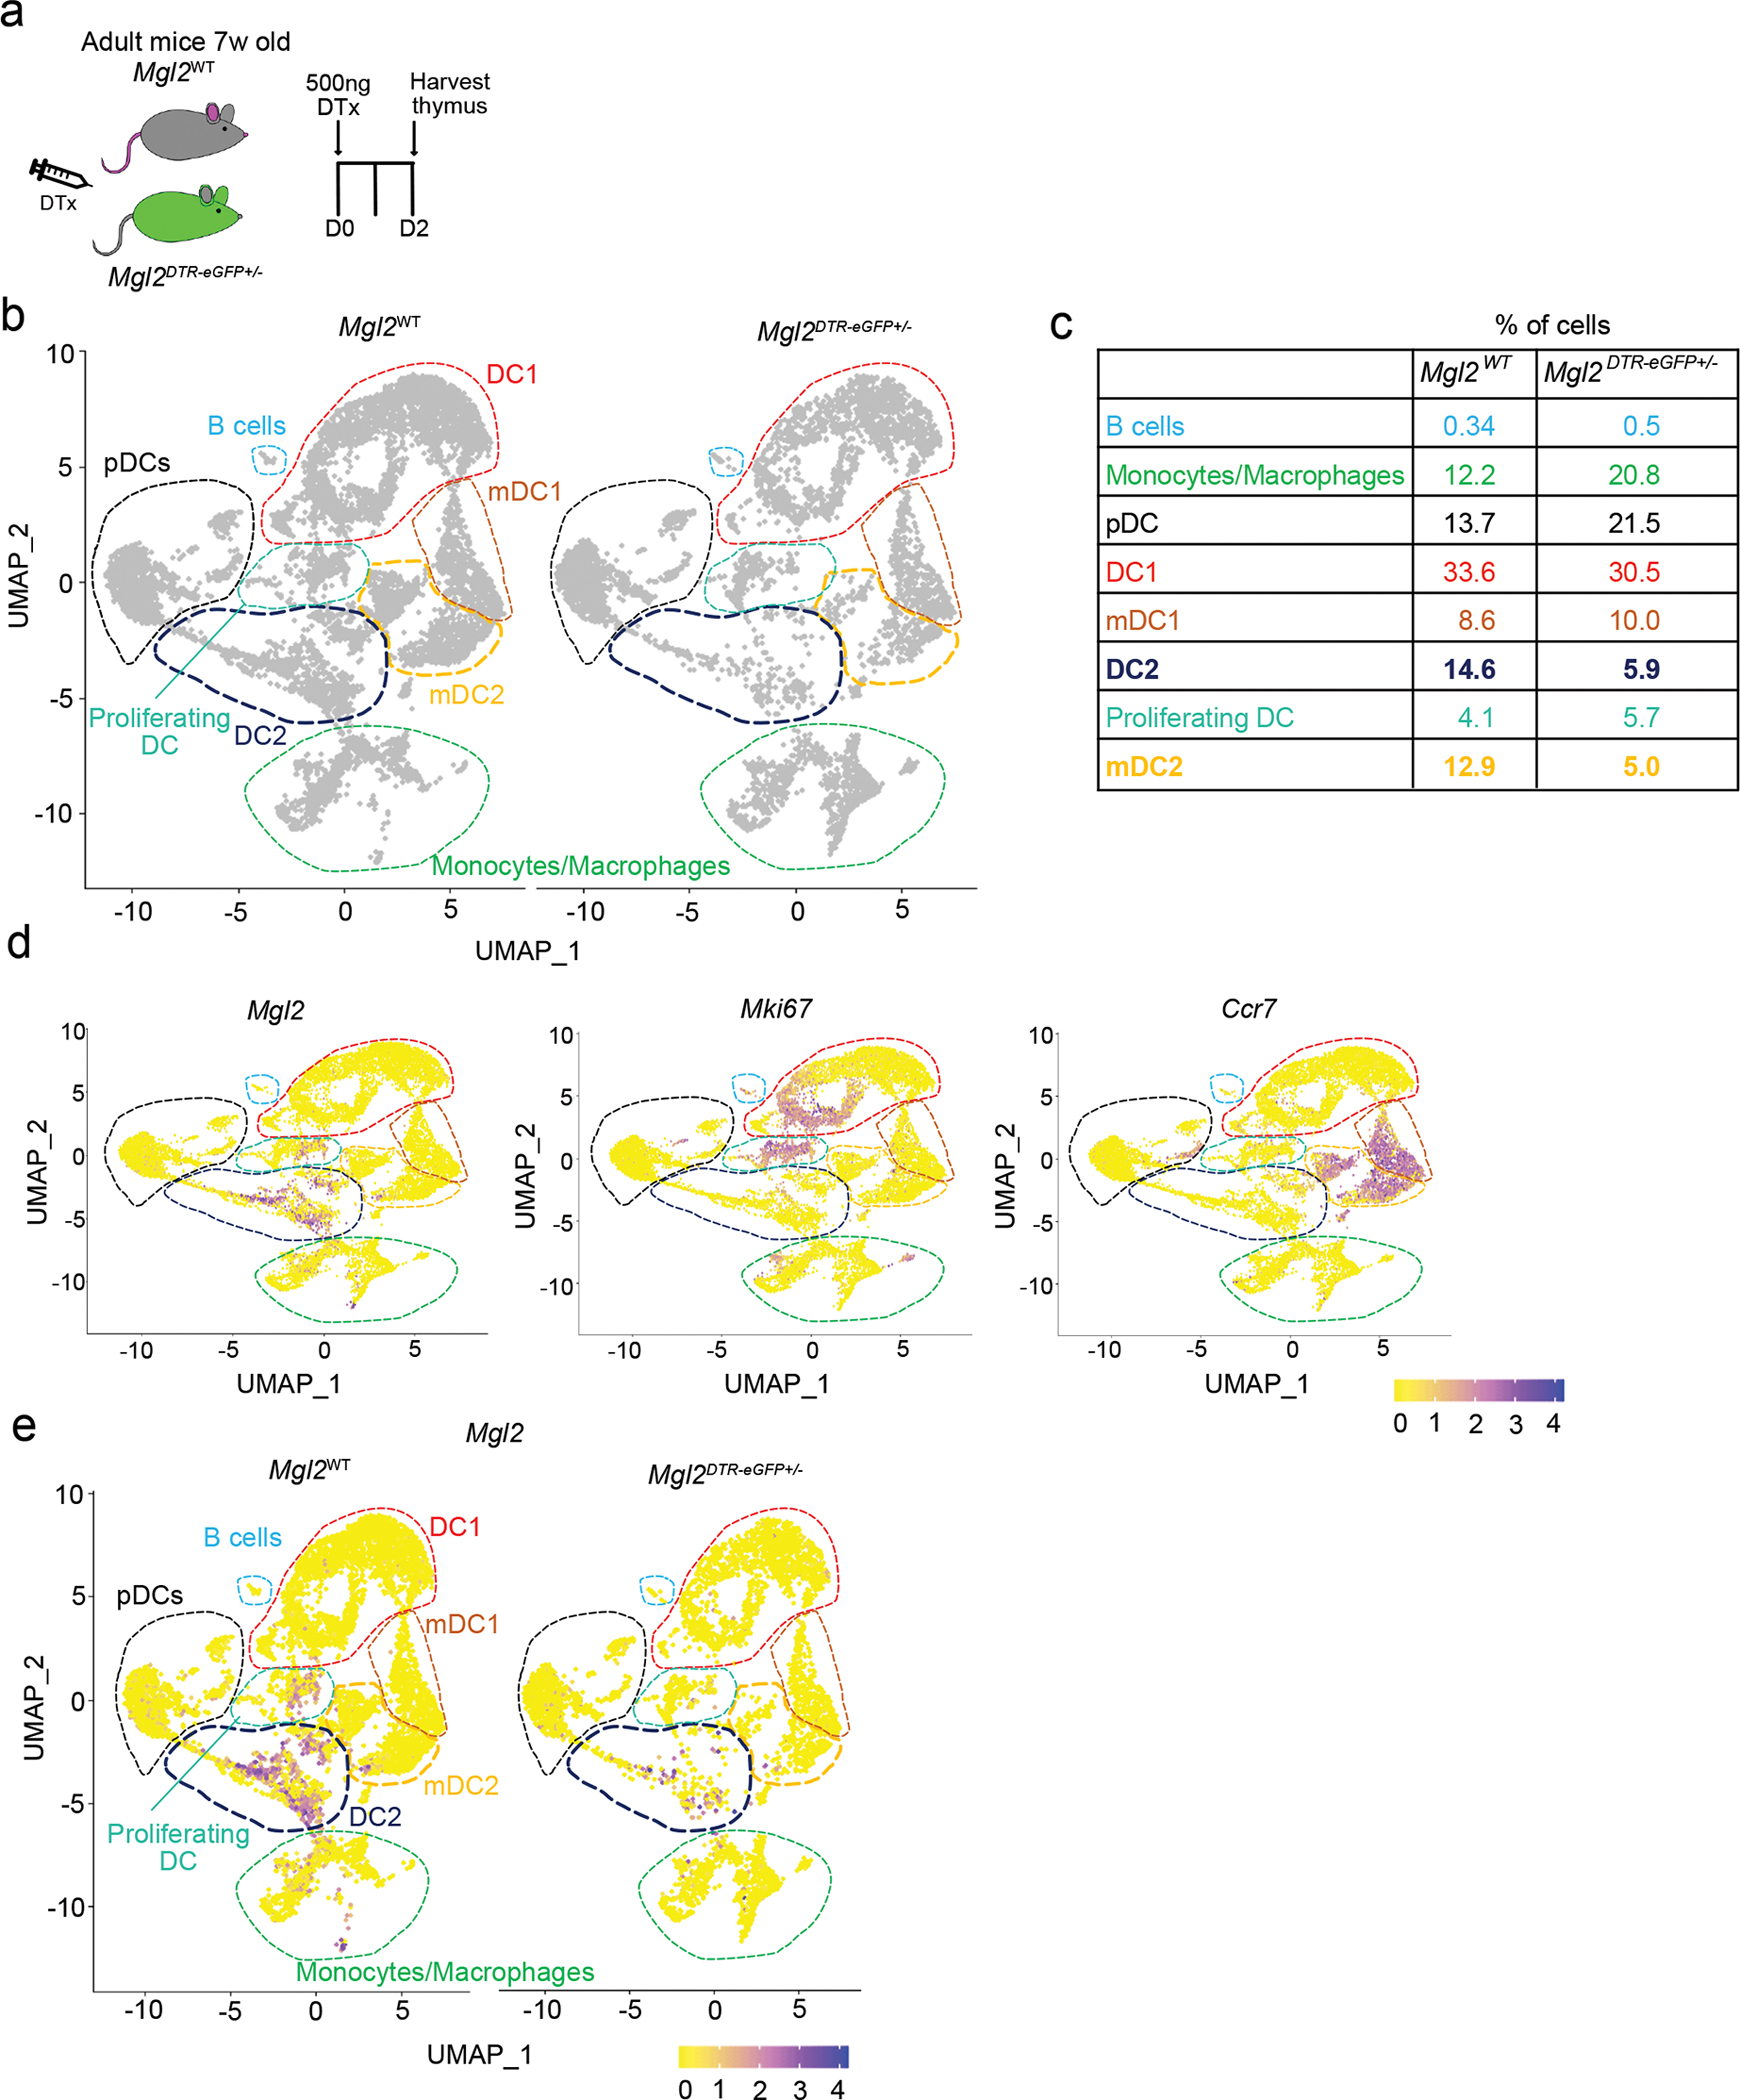
Extended Data Fig. 7. scRNA sequencing analysis of thymic myeloid cell depletion in Mgl2DTR-eGFP mice.

(a) Experimental strategy for selective depletion of cells in Mgl2DTR-eGFP mice. (b) The CD11c+ and CD11b+ cells (gated as in Supplementary figure 4) from diphtheria toxin (DTx) treated Mgl2WT (left plot) or Mgl2DTR-eGFP (right plot) were FACS-sorted, captured with a 3’ Single Cell V5 chemistry platform, and sequenced. Cell hashing was used to distinguish the genotypes of origin. The non-myeloid and granulocyte populations was bioinformatically depleted from the analysis. UMAP plots showing the analysis of 13,129 transcriptome events (Mgl2WT = 8,175, Mgl2DTR-eGFP = 4,959) and identified 8 major clusters marked by dashed lines. The clusters showing the most diffence in abundance of events between the genotypes (cDC2 and mDC2) are marked by bold navy and yellow lines. (c) Enumeration of clusters frequencies from CD11c/CD11b+ cells identified in b. (d) Feature plots showing normalized expression of Mgl2, Mki67 and Ccr7 genes in clusters identified in b. (e) Feature plots comparing the Mgl2 expression between Mgl2WT and Mgl2DTR-eGFPmice. Seven-week-old male mice were used.
