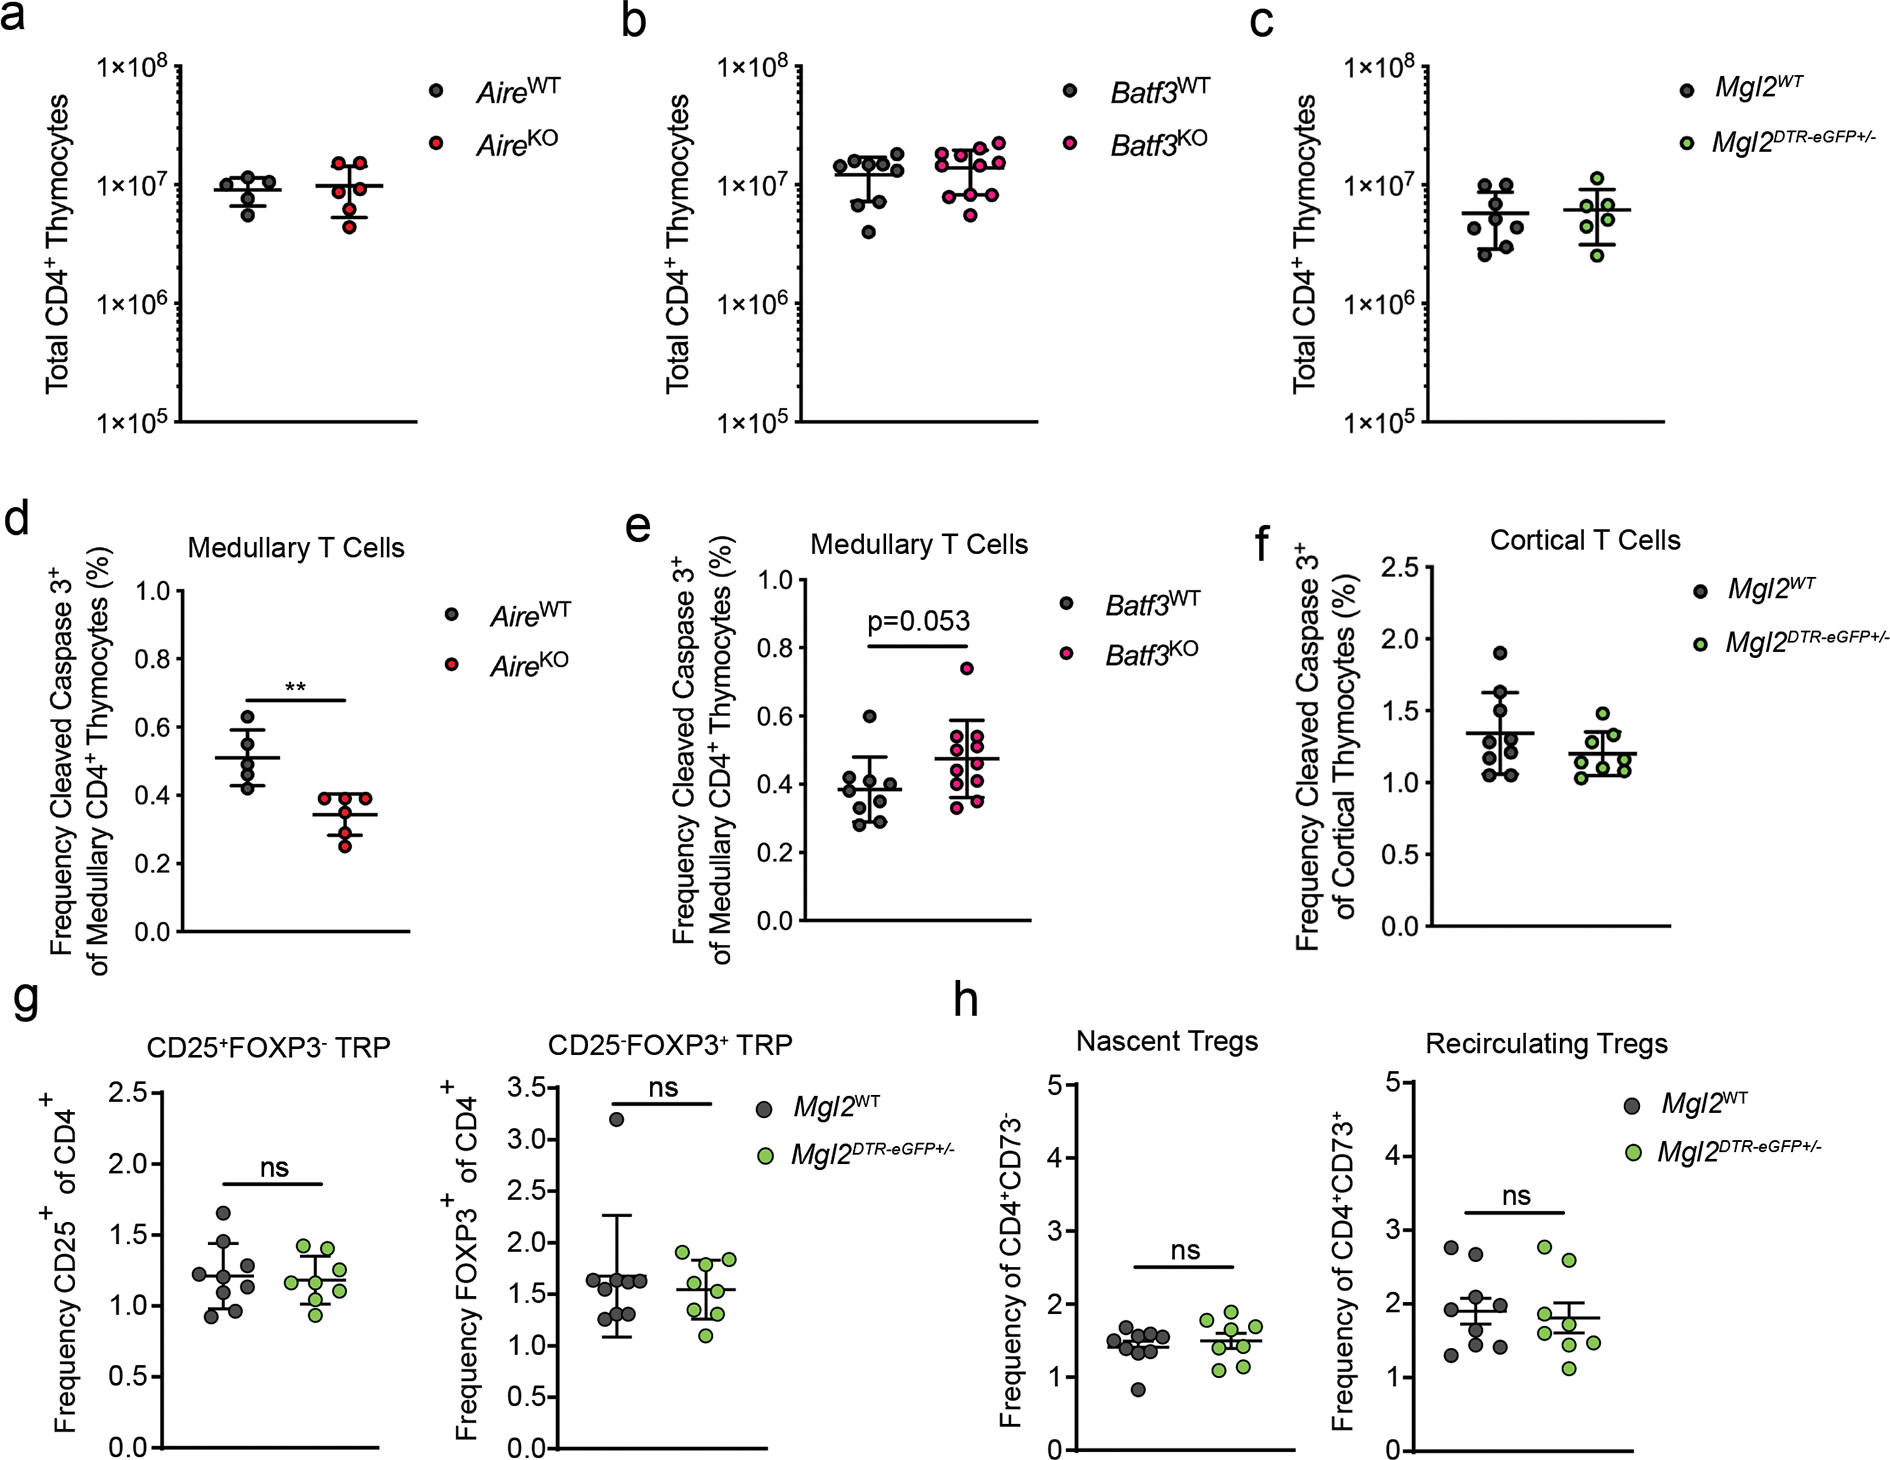
Extended Data Fig. 9. Frequencies of thymic T cell populations.

(a-c) Total CD4 T cells in mice with selective deficiencies. The administration of DTx into Mgl2DTR-eGFP mice was done as in Figure 5d. (d and e) Frequency of CD5+ TCRβ+ cleaved caspase 3+ thymocytes among CCR7+ CD4 T cells in in mice with selective deficiencies (gated as in Extended Data Fig. 8). (f) Frequency of CD5+ TCR+ cleaved caspase 3+ thymocytes among DP T cells in Mgl2WT (n=9) or Mgl2DTR-eGFP (n=8). The administration of DTx into Mgl2DTR-eGFP mice was done as in Figure 5d. (a-e) AireWT (n=5) or AireKO (n=6), Batf3WT (n=9) or Batf3KO (n=11) and Mgl2WT (n=8) or Mgl2DTR-eGFP (n=6) mice were used. (g) Frequency of CD25+FOXP3− and CD25−FOXP3+ Treg cell progenitors (TRP) and (h) nascent CD25+ FOXP3+ CD73− and recirculating CD25+ FOXP3+ CD73+ Treg cells in Mgl2WT (n=9) or Mgl2DTR-eGFP (n=8) mice following 9 days of diphtheria toxin treatment. The administration of DTx into Mgl2DTR-eGFP mice was done as in Figure 5d. Each symbol represents an individual mouse. Six to twelve-week-old male and female mice were used. Small horizontal lines indicate the mean and error bars represent SD. ns=not significant, *P< 0.05, **P<0.01. Data are pooled from at least three independent experiments. Unpaired Mann-Whitney test was used.
