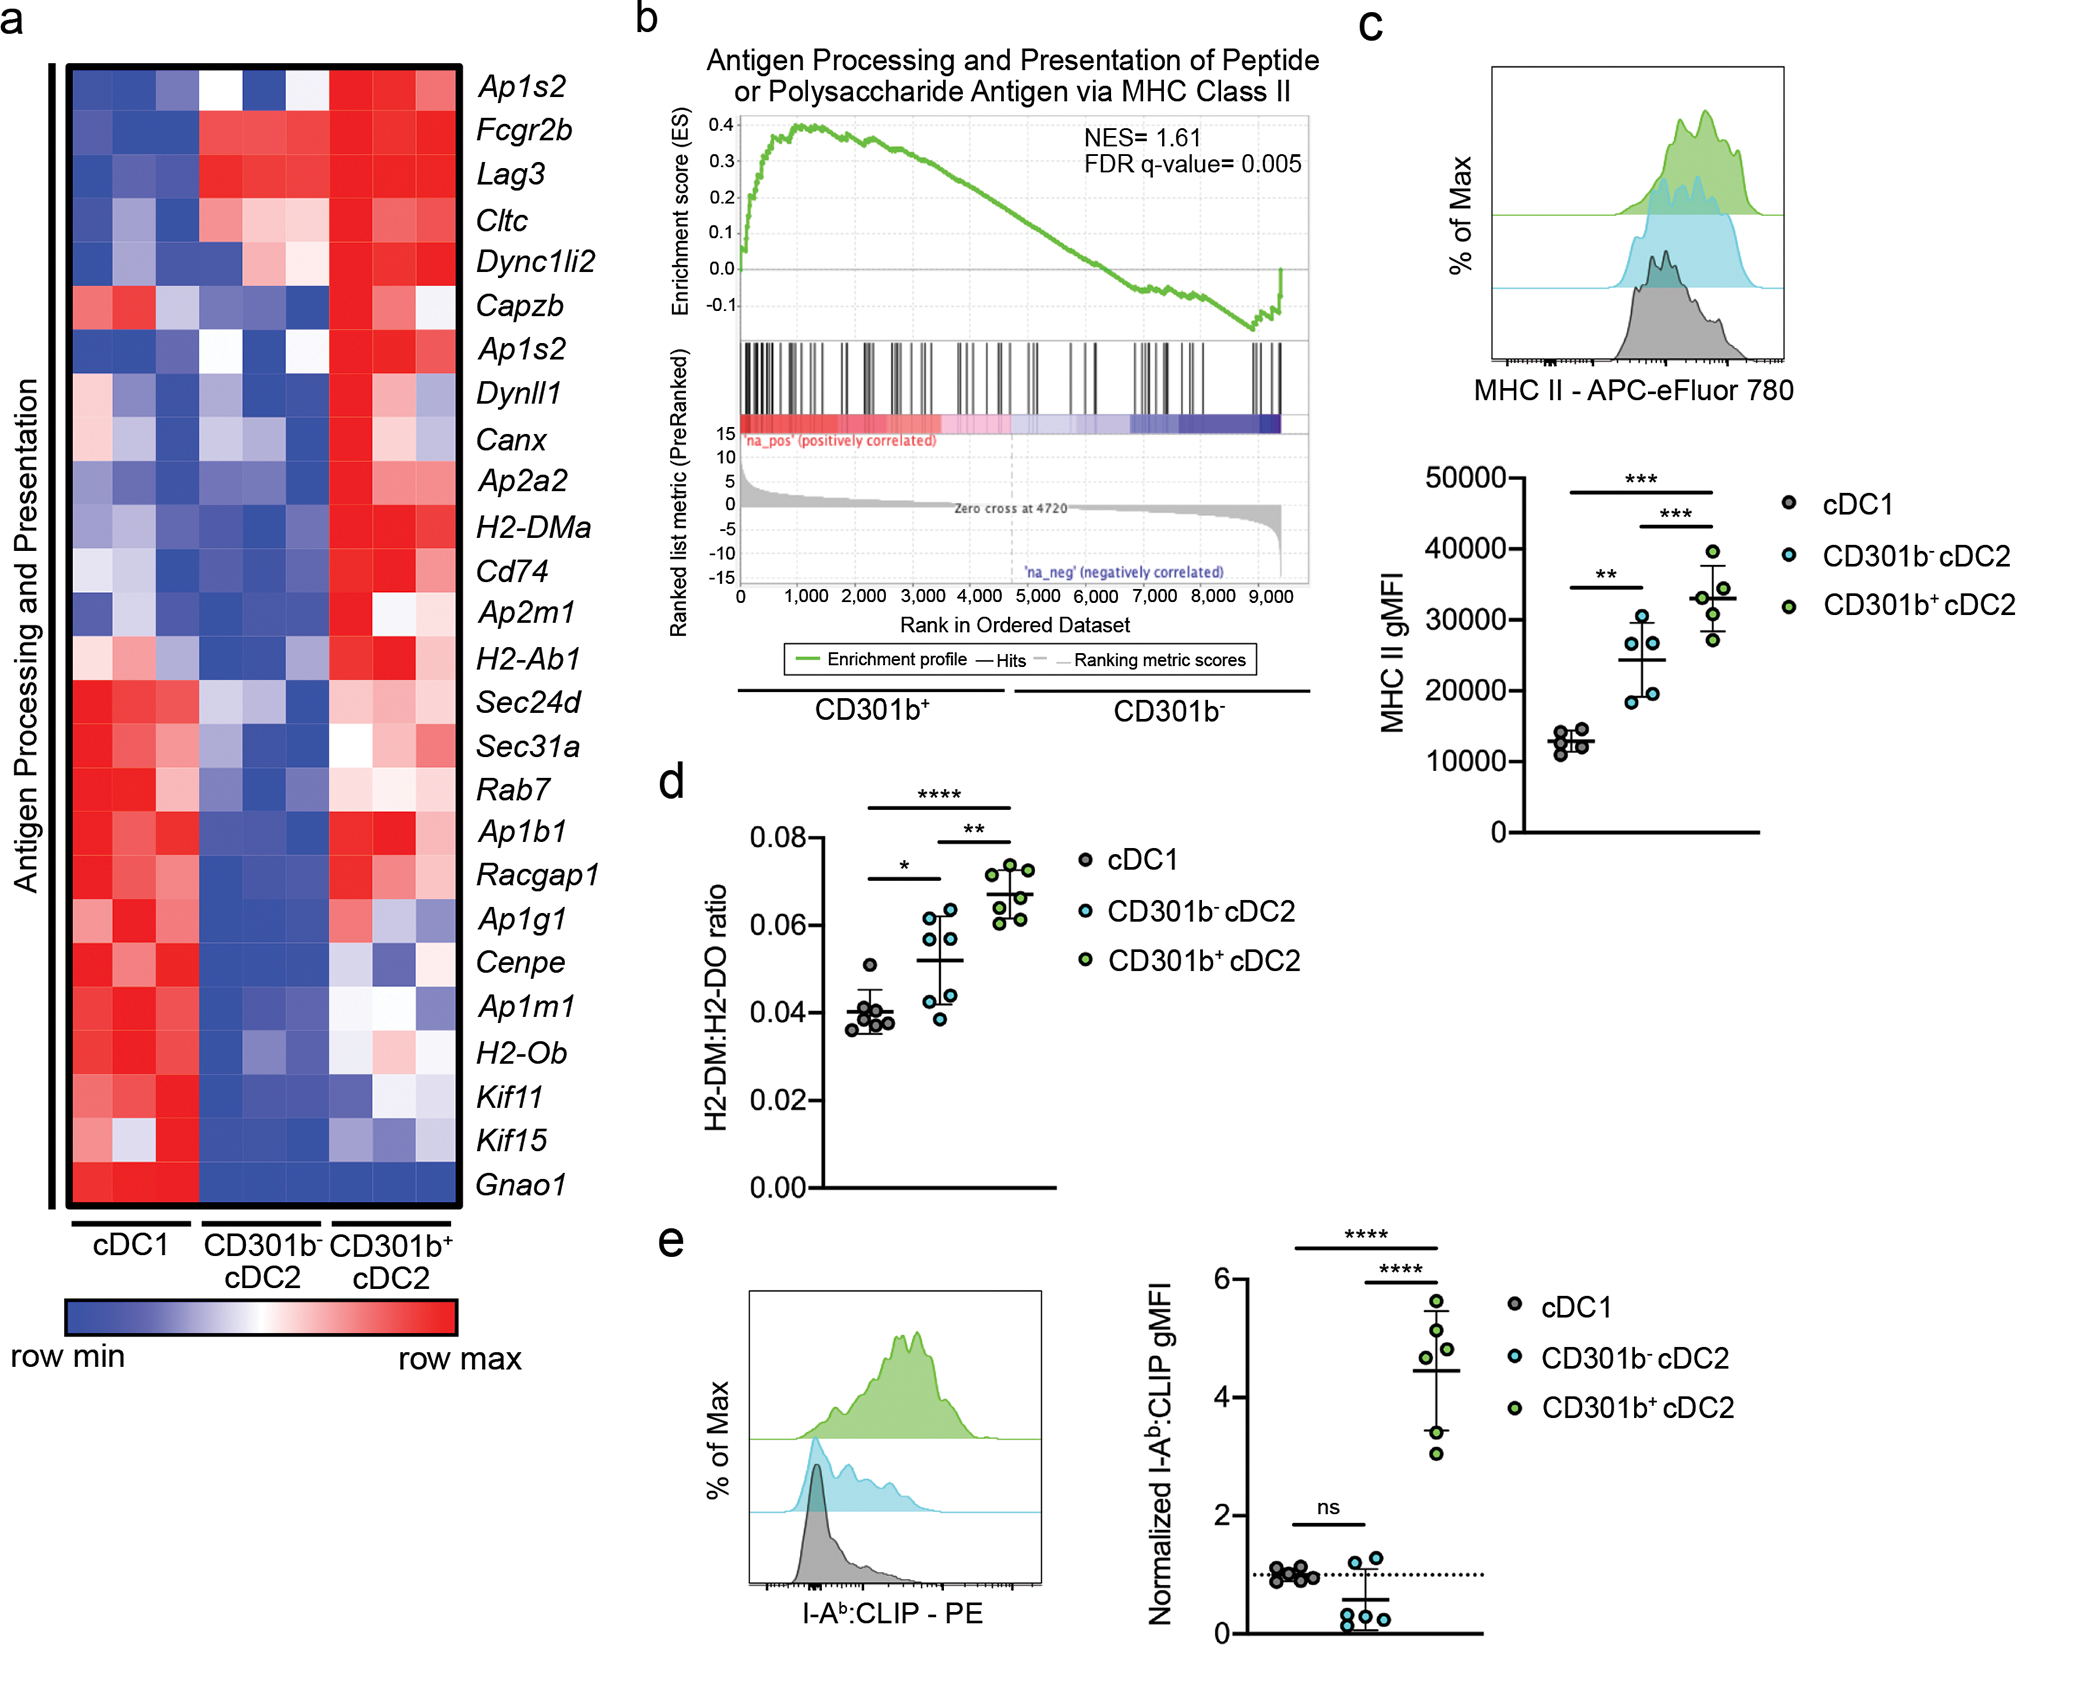
Fig. 3. Thymic CD301b+ cDC2 have characteristics of enhanced antigen presentation.

(a) Heatmap displaying the relative expression of leading-edge genes from ANTIGEN_PROCESSING_AND_PRESENTATION_OF_PEPTIDE_OR_POLYSACHARIDE_ANTIGEN_VIA_MHC_CLASS_II gene set in sorted thymic XCR1+ cDC1, CD301b− cDC2, and CD301b+ cDC2 from 8-week-old C57BL/6 mice. (b) Gene set enrichment analysis showing the enrichment for antigen processing and presentation signature genes in thymic CD301b− and CD301b+ cDC2. NES, normalized enrichment score. FDR q-value, false discovery rate. (c) Representative flow cytometry of thymic XCR1+ cDC1, CD301b− cDC2, and CD301b+ cDC2 stained for MHC II (top) and geometric mean fluorescence intensity (gMFI) (bottom) in C57BL/6 mice (n=5). (d) gMFI ratio of intracellular H2-DM:H2-DO in XCR1+ cDC1, CD301b− cDC2, and CD301b+ cDC2 in C57BL/6 mice (n=7). (e) Representative flow cytometry of thymic XCR1+ cDC1, CD301b− cDC2, and CD301b+ cDC2 stained intracellularly for IAb:CLIP (left) and gMFI normalized to controls (right) in C57BL/6 mice (n=6). Each symbol (c, d, e) represents an individual mouse. Six to twelve-week-old male and female mice were used. Small horizontal lines indicate the mean, and error bars represent SD. Data are pooled from at least two independent experiments (c, d, e). ns=not significant, *P<0.05, **P<0.01, ***P< 0.001, ****P< 0.0001. One-way ANOVA with Tukey’s multiple comparisons test was used.
