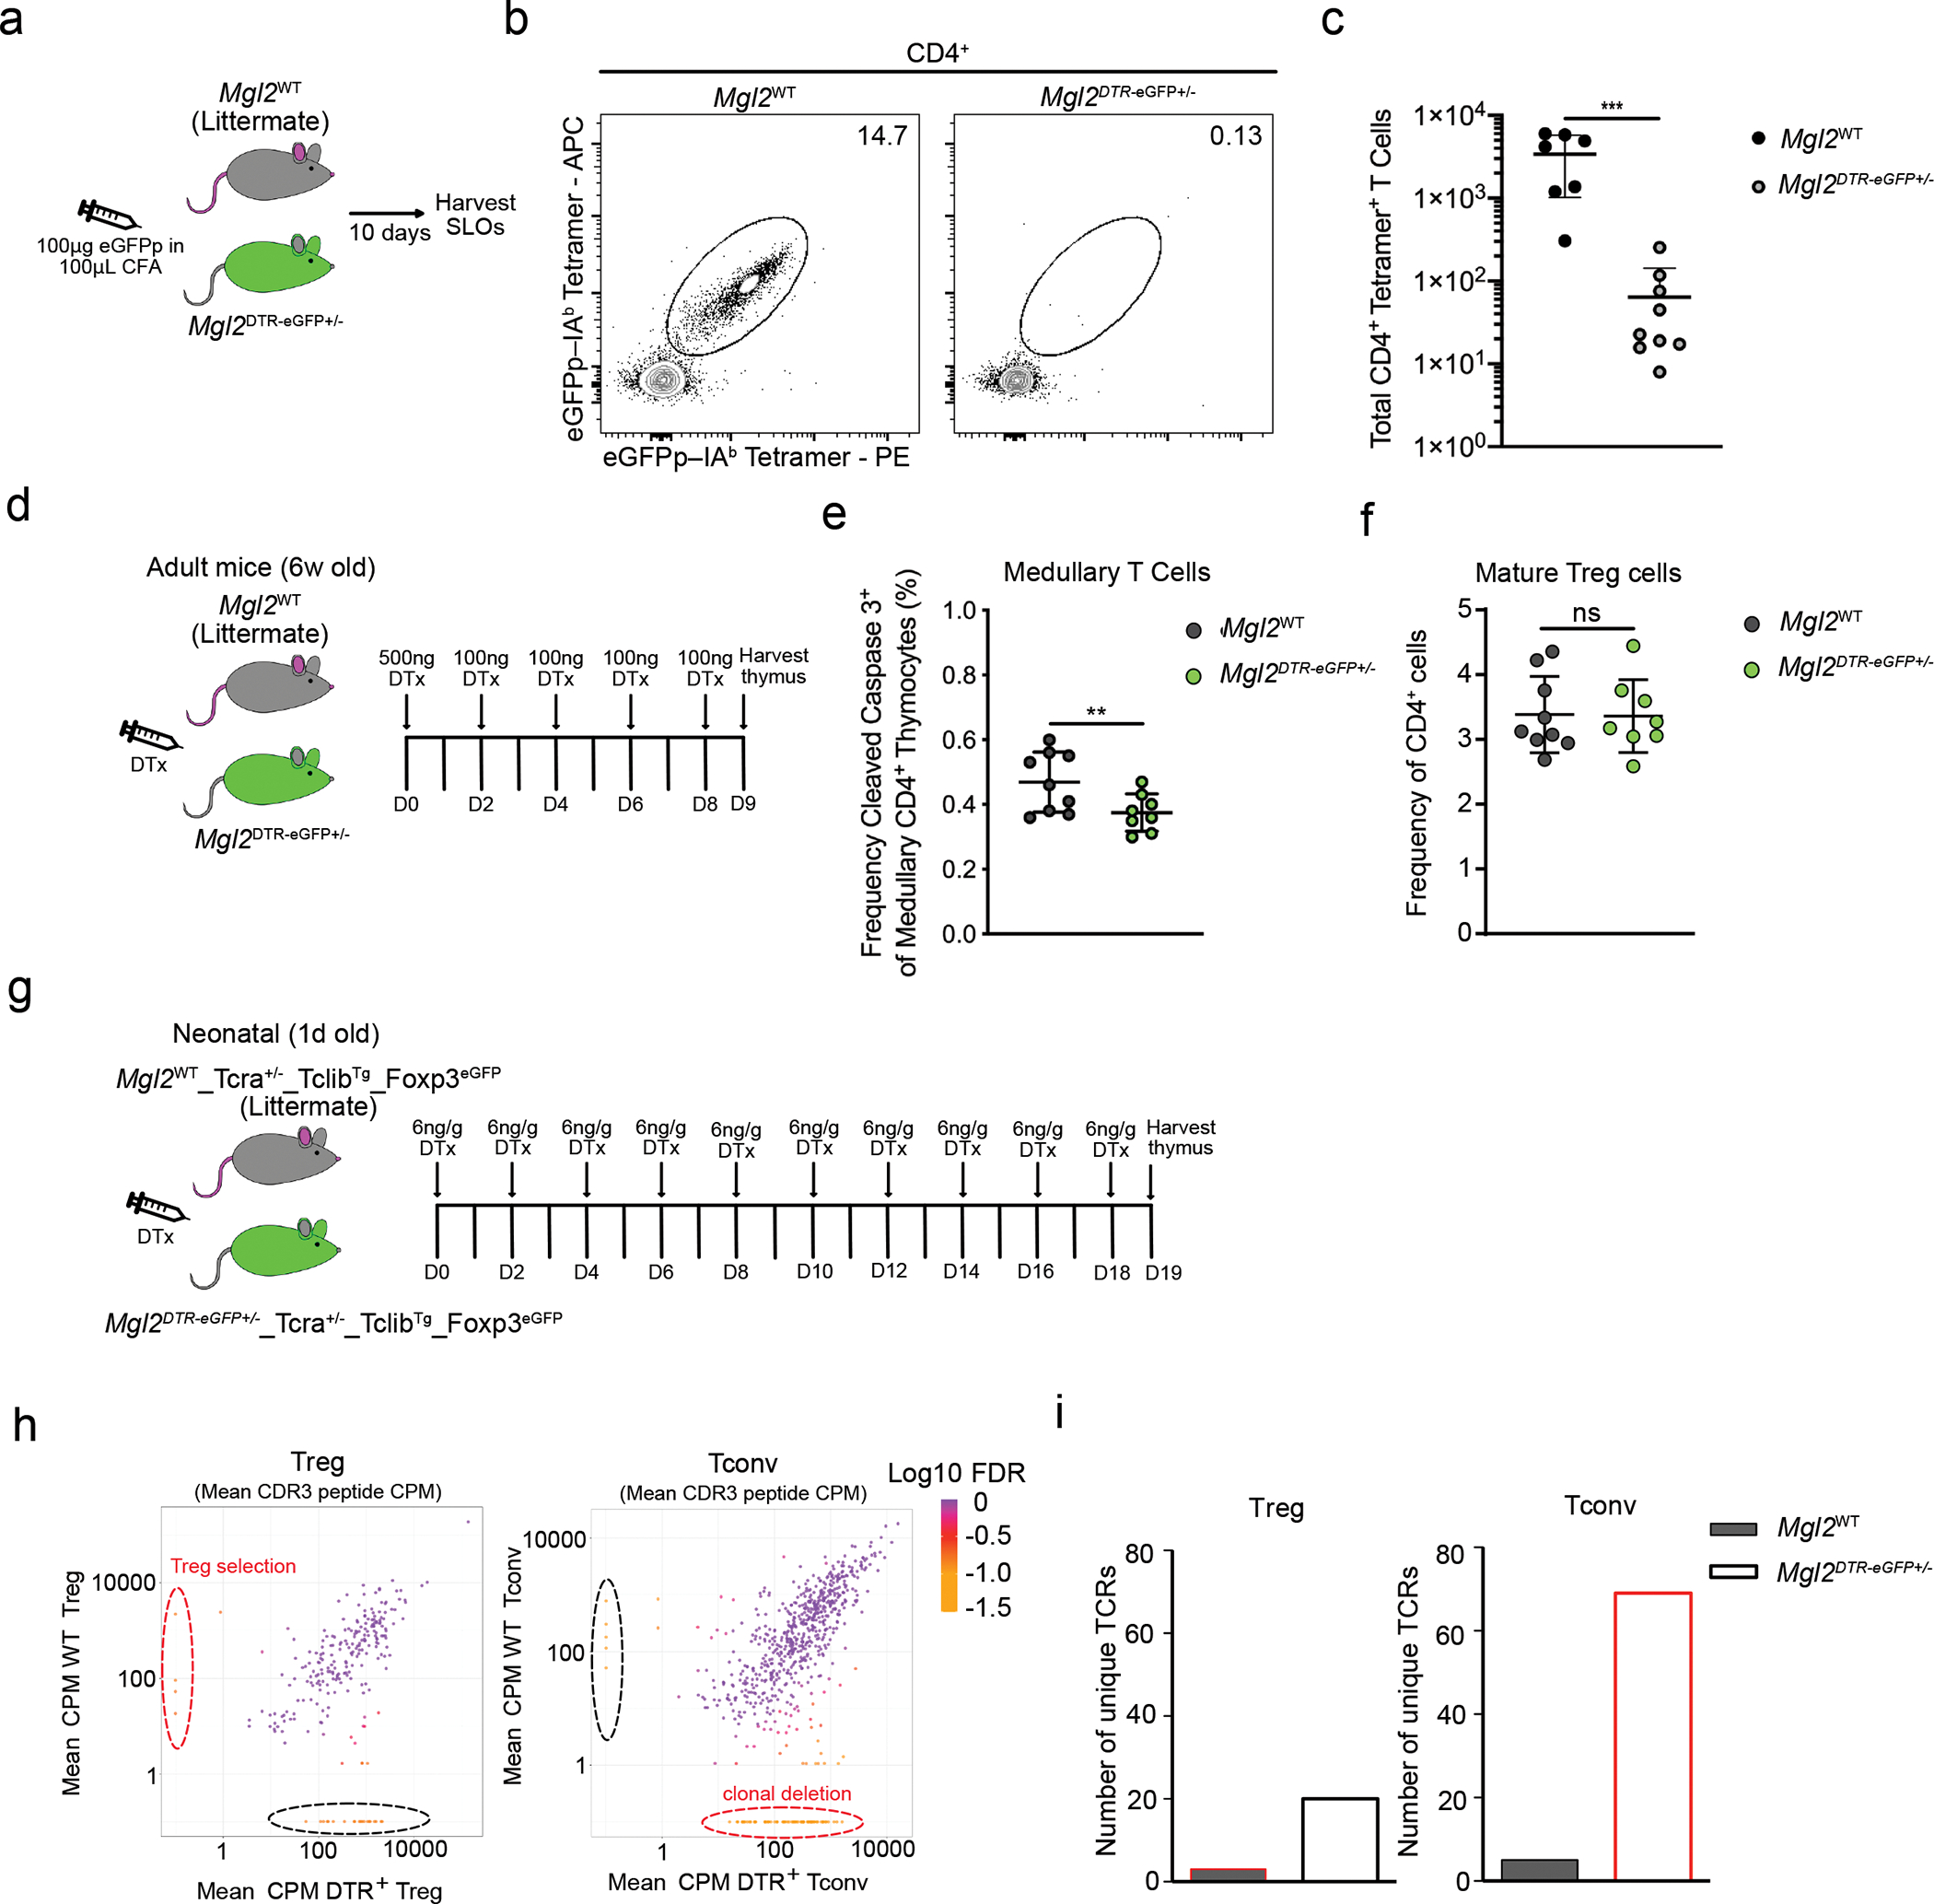
Fig. 5. CD301b+ cDC2 mediate clonal deletion.

(a) Experimental strategy for eGFPp immunization. (b) Representative flow cytometry of eGFPp–IAb–PE and eGFPp–IAb–APC staining of tetramer-enriched CD4 T cells from pooled spleens and lymph nodes of Mgl2WT (n=7) and Mgl2eGFP+/− (n=9) mice 10 days after immunization with 100μg eGFPp emulsified with CFA. (c) Total eGFPp–IAb–tetramer-binding CD4 T cells (as in Fig. 5b). (d) Experimental strategy for selective depletion of CD301b+ cDC2 (Mgl2DTR). (e) Frequency of CD5+ TCRβ+ cleaved caspase 3+ thymocytes among CCR7+ CD4 T cells in Mgl2WT (n=9) or Mgl2DTR (n=8) mice following 9 days of diphtheria toxin treatment (gated as in Extended Data Fig. 8). (f) Frequency of mature (CD4+CD25+FOXP3+) Tregs in Mgl2WT (n=9) or Mgl2DTR (n=8) mice following 9 days of diphtheria toxin treatment. (g) Experimental strategy for selective depletion of CD301b+ cDC2 and further bulk RNA sequencing of TCRs. (h) Changes in mean CDR3 peptide CPM (counts per million reads mapped) in Tregs (left graph) and CD4+ Tconvs (right graph) from Mgl2WTTcra+/−TclibTgFoxp3eGFP and Mgl2DTRTcra+/−TclibTgFoxp3eGFP mice (n=4 mice per genotype). The Log10 FDR (False discovery rate) of for each CDR3 peptide CPM is shown. (i) Comparison of numbers of unique TCRs (marked by dashed lines in h) between the Tregs and Tconvs from mice described in h. The color code is similar as in h. Each symbol (c, e) represents an individual mouse. Six to twelve-week-old male and female mice were used except for (h, i) where newborn mice were used. Small horizontal lines indicate mean and error bars represent SD. Data are representative of at least three independent experiments (b), are pooled from at least three independent experiments (c, e, f) or are generated from 4 mice per genotype (h, i). **P<0.01, ***P< 0.001. Two-tailed Unpaired Student’s t test was used.
