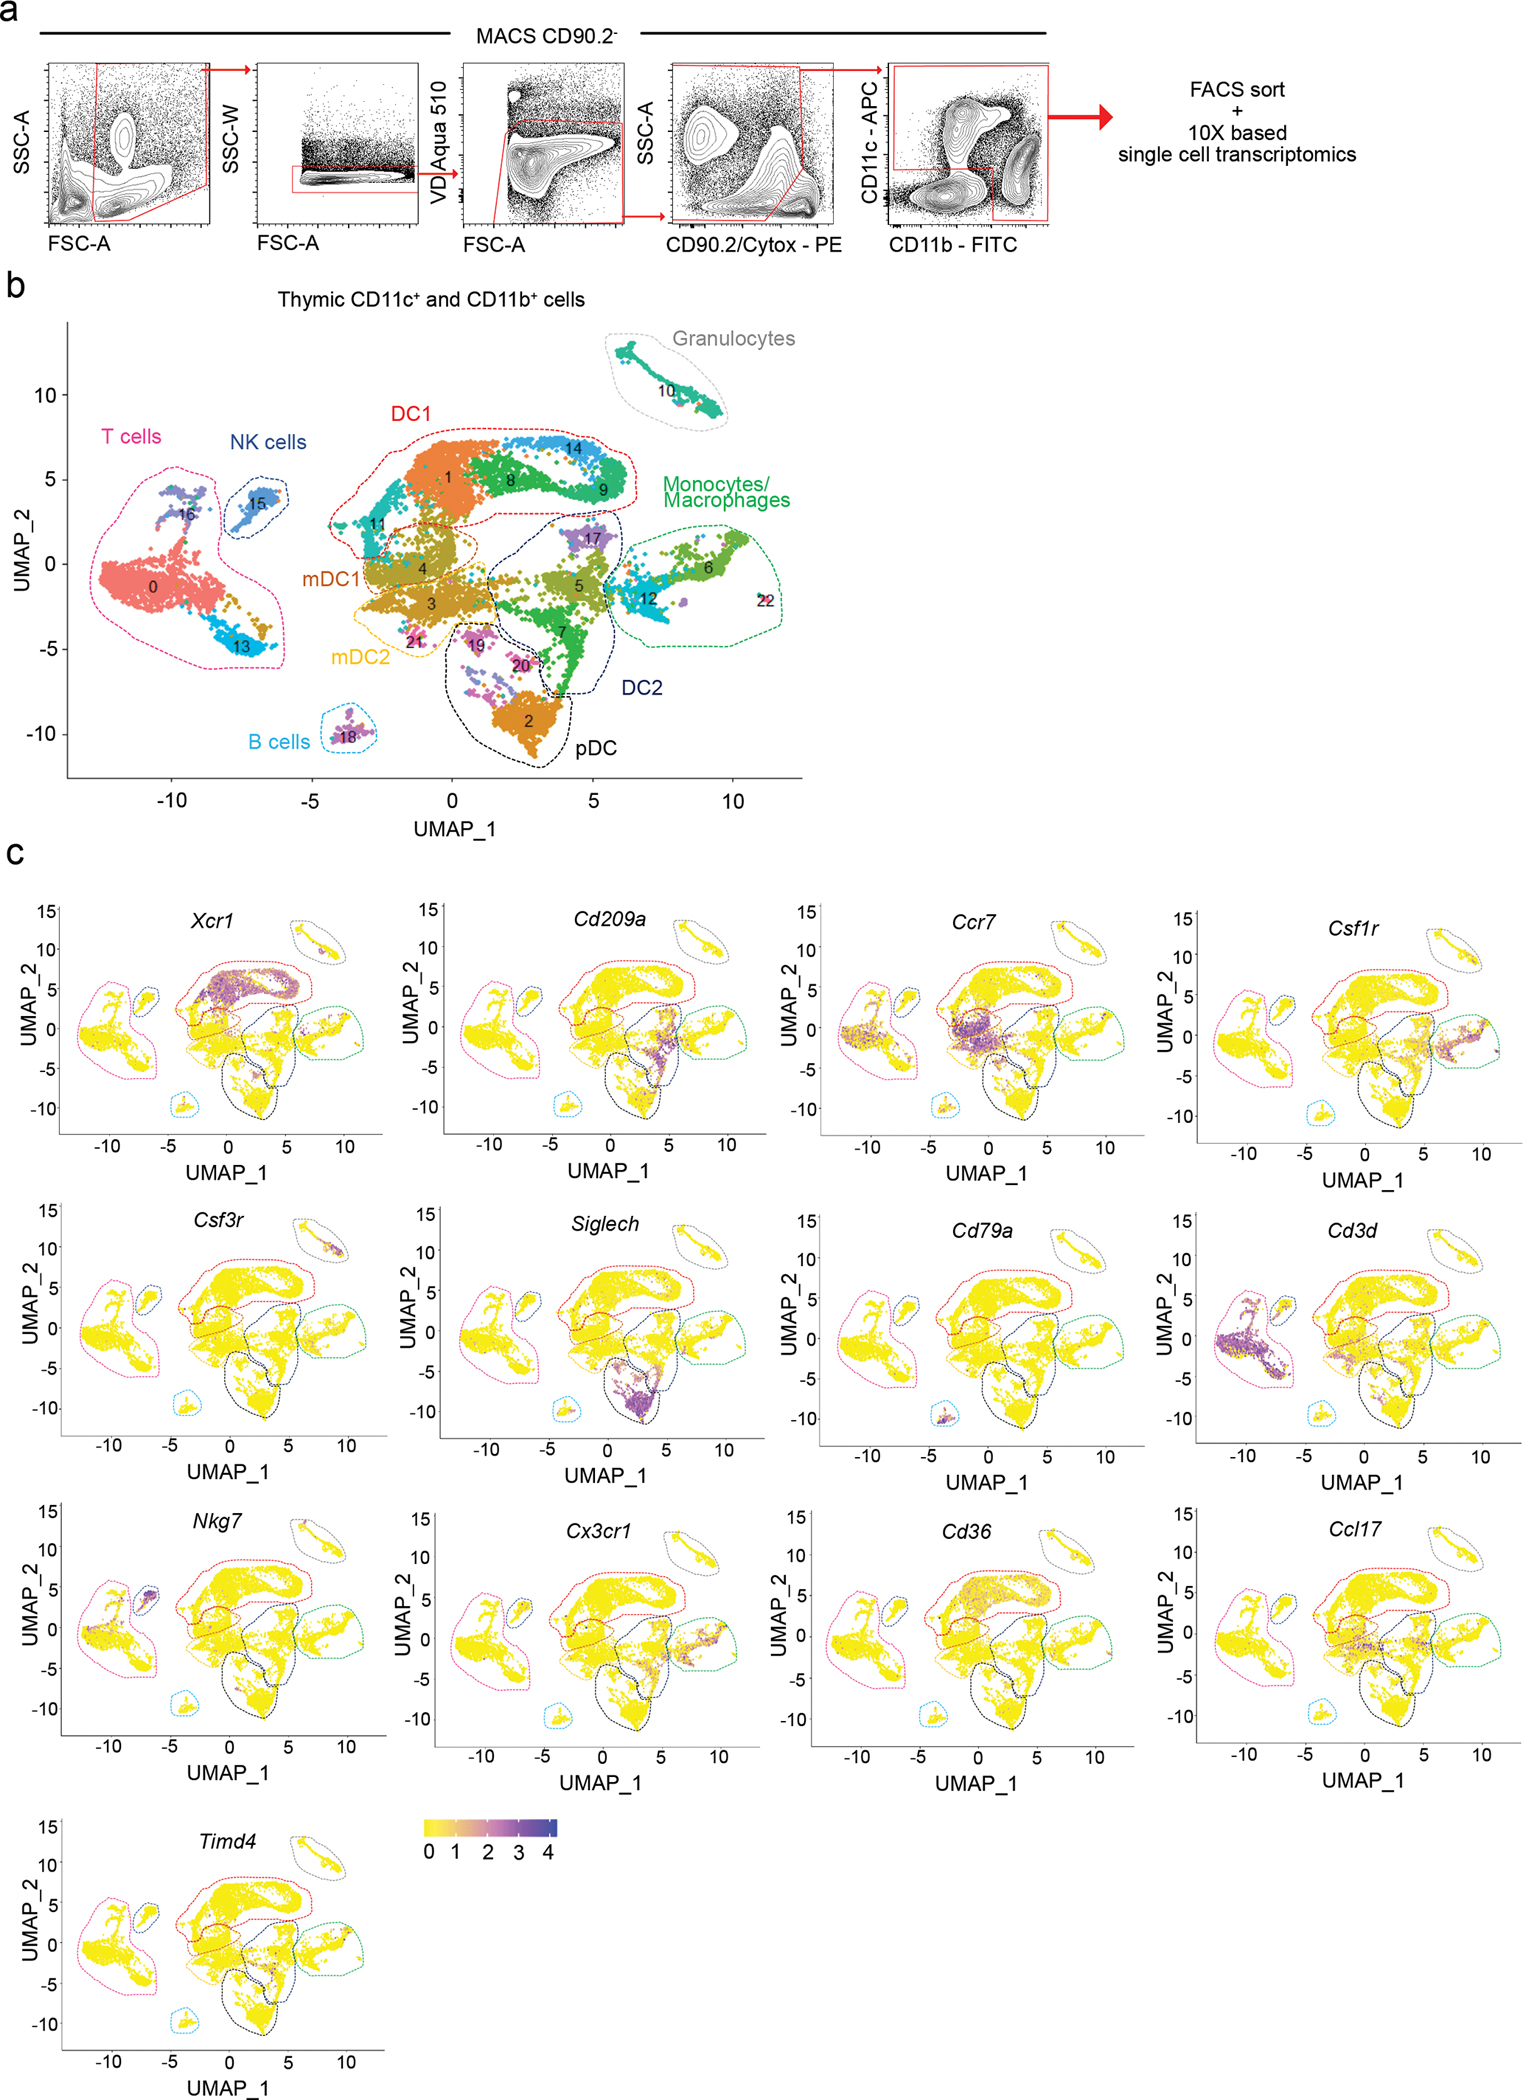
Extended Data Fig. 4. Identification of clusters in scRNA sequence data of thymic myeloid (CD11c+ CD11b+) cells.

(a) Flow cytometric gating strategy for sorting the thymic CD11c+ and CD11b+ populations for single-cell RNA (scRNA) sequencing. Cells were MACS enriched for CD90.2− cells. Dead cells were gated out using Viability Dye Aqua 510 and Cytox. CD90.2− CD11c+ and CD11b+ cells were sorted, captured with a 3’ Single Cell V5 chemistry platform, and sequenced. (b) UMAP plot showing the analysis of 10,234 transcriptome events identifying 22 color-coded clusters that were divided into 10 main populations marked by dashed lines. (c) Feature plots showing normalized expression of signature genes associated with clusters defined in b. Seven-week-old male mice were used.
