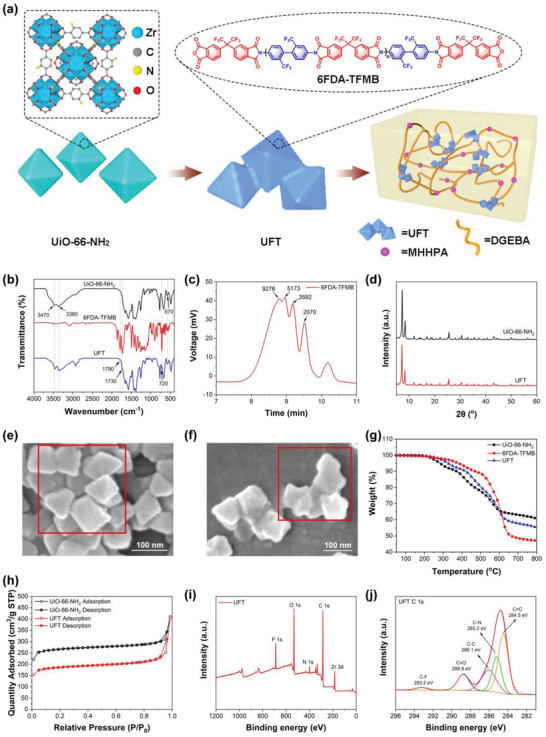
Figure 1.

a) Schematic diagram of the preparation process of UFT composites. b) FT‐IR spectra of UiO‐66‐NH2, 6FDA‐TFMB, and UFT. c) GPC curve of 6FDA‐TFMB. d) XRD spectra of UiO‐66‐NH2 and UFT. e) SEM micrograph of UiO‐66‐NH2. f) SEM micrograph of UFT. g) TGA plots of UiO‐66‐NH2, 6FDA‐TFMB, and UFT under N2 atmosphere. h) N2 adsorption–desorption isotherms of UiO‐66‐NH2 and UFT. i) XPS spectra of UFT and j) its high‐resolution C1s spectra.
