
Figure 3.
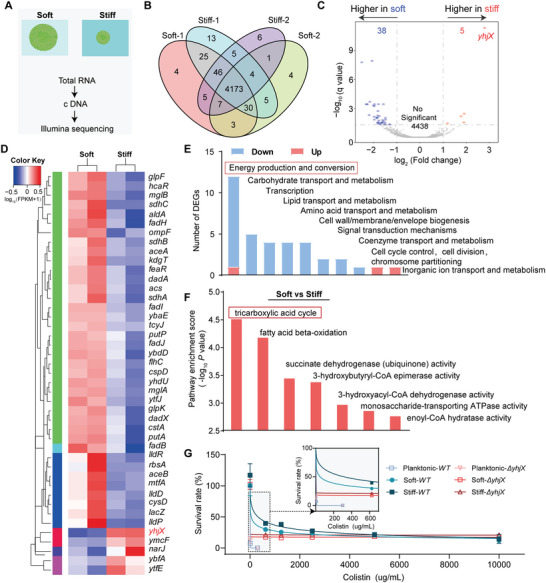
Bacterial microcolonies living in soft and stiff hydrogels showed distinct transcriptional profiles. A) Experimental procedures for transcriptional sequencing of bacterial microcolonies grown in soft and stiff hydrogels. B) Venn diagram of transcriptomes bacterial microcolonies in the soft and stiff hydrogels. C) Volcano map of differentially expressed genes (DEGs) for the bacterial microcolonies grown in soft and stiff hydrogels, which were plotted in logarithmic coordinates. D) Cluster map of differential genes expressed in the bacterial microcolonies grown in the soft and stiff hydrogels, where red represented highly expressed genes while blue denoted low expressed ones. E) Distribution map of clusters of orthologous groups (COGs), in which the horizontal axis represented the COG classification while the vertical axis presented the number of differential genes. Blue and red bars denoted down‐regulated and up‐regulated genes, respectively. F) Gene ontology (GO) enrichment analysis (p‐value < 0.05), where the horizontal axis listed the enrichment GO terms whereas the vertical axis showed their respective values of ‐log10 (p‐value), which quantified the extent of GO enrichment of the enrichment GO terms regulated by 3D hydrogel stiffness. The higher the value, the more significant the degree of enrichment. G) Quantitative dependence of survival rates of WT and ΔyhjX E. coli ATCC 25922. The bacteria were cultured in the planktonic state, soft, and stiff MA hydrogel samples with the concentration of broth microdilution colistin ranging from 0 to 10 000 µg mL−1. Data were presented as mean ± SD from at least three individual experiments (n = 8).