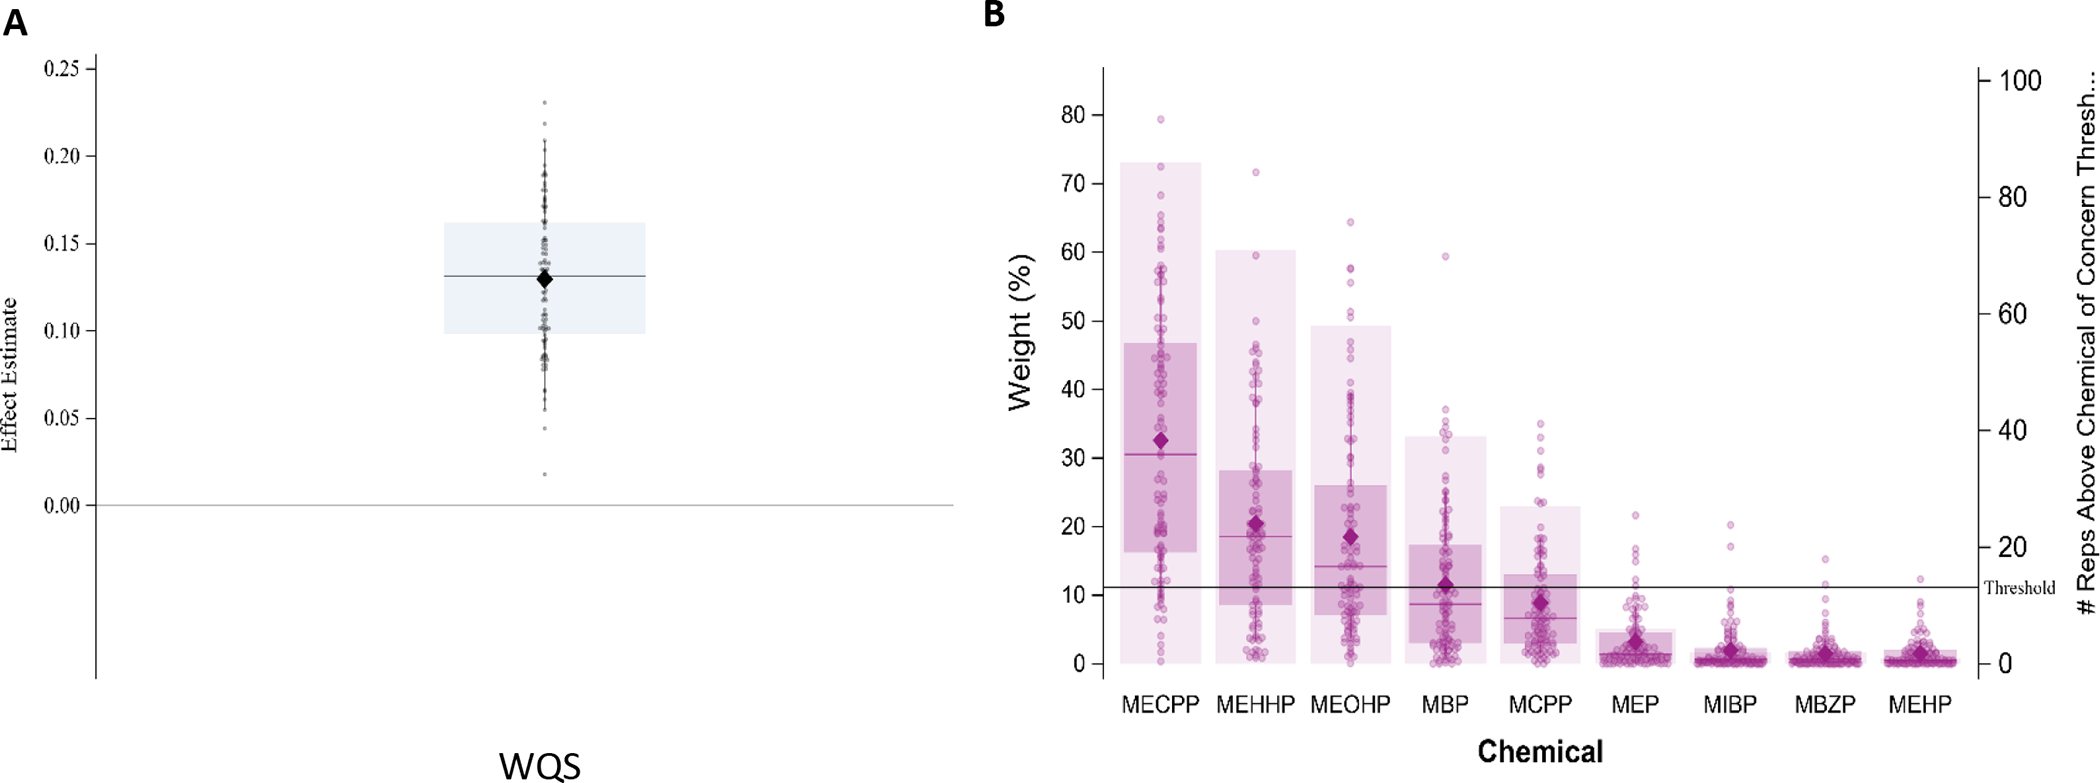
Figure 3:

Results from 100 repeated holdouts testing the association between the phthalate index and rate of the first growth spurt, controlling for sex, SGA, NICU morbidity score, and year of birth (N=96; training n~38, validation n~58). A. shows the distribution of WQS estimates and B. shows the distribution of weights for each phthalate metabolite. For both A. and B., data points represent the estimate for each holdout and the closed diamond shows the mean effect estimate. For A., the boxplot shows the 25th, 50th, and 75th percentiles and the whiskers show the 2.5th and 97.5th percentiles and for B., the boxplot shows the 25th, 50th, and 75th percentiles and the whiskers show the 10th and 90th percentiles.
