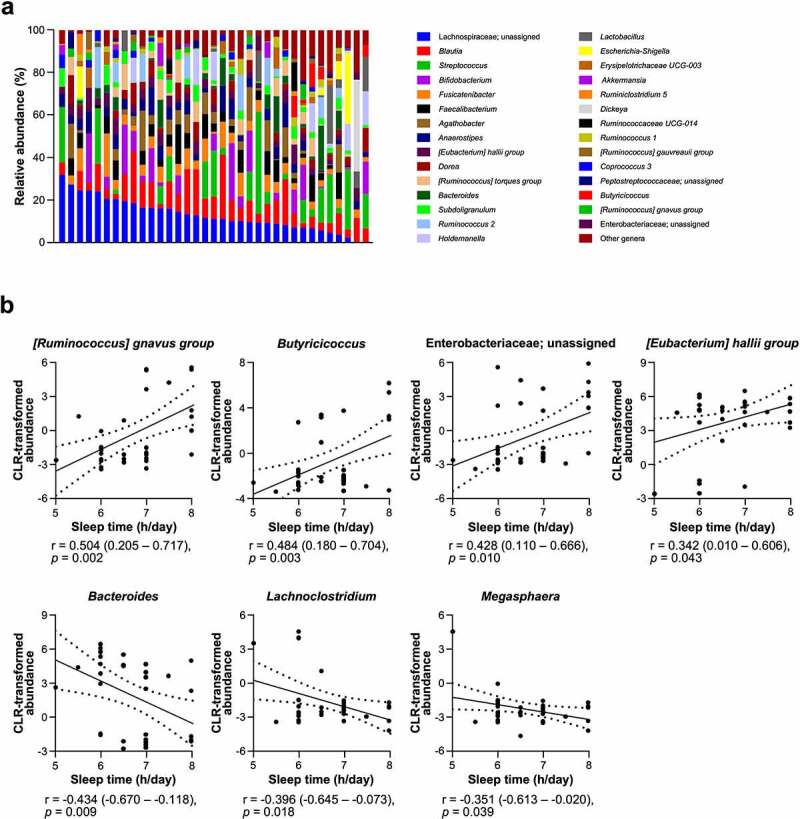
Figure 2.

Sleep time is associated with occupancy of several genera in the intestinal microbiota .
(a) Intestinal microbiota composition of each participant at the genus level. Participants were sorted by relative abundance of Lachnospiraceae; unassigned in descending order. Genera which average of relative abundance in all participants was below 0.5% were integrated as “Other genera”. (b) Correlation analysis between sleep time and centered log ratio (CLR)-transformed abundance of each genus. Statistical significance was evaluated by Pearson’s correlation coefficient test. Values in parentheses and dashed lines in the plots represent the range of 95% confidence interval.
