Figure 7.

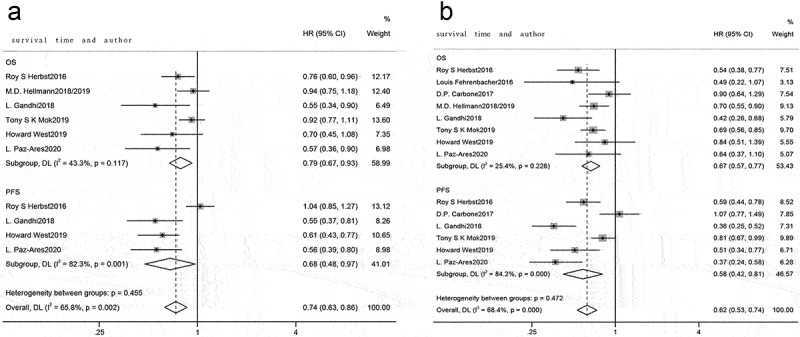
Forest plots for PD-L1 TPS 1–49% and TPS ≥50%. (a) PD-L1 TPS 1–49%, forest plot comparing OS and PFS between immunotherapy and chemotherapy; (b) PD-L1 TPS ≥50%, forest plot comparing OS and PFS between immunotherapy and chemotherapy.

Forest plots for PD-L1 TPS 1–49% and TPS ≥50%. (a) PD-L1 TPS 1–49%, forest plot comparing OS and PFS between immunotherapy and chemotherapy; (b) PD-L1 TPS ≥50%, forest plot comparing OS and PFS between immunotherapy and chemotherapy.