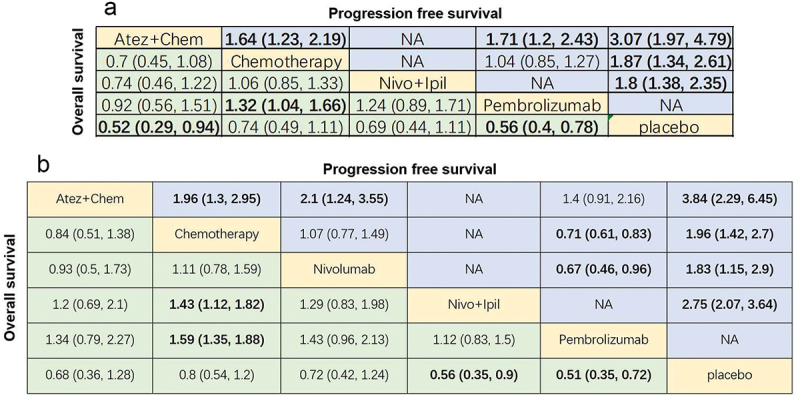
Figure 9.

League chart of subgroup analysis. (a) Combined HR (95%CI) for PFS (upper triangle) and OS (lower triangle) of patients with PD-L1 1–49%; (b) Combined HR (95%CI) for PFS (upper triangle) and OS (lower triangle) of patients with PD-L1 ≥ 50%; the data in each cell is HR or OR (95% CI) comparing row definition processing and column definition processing. HR <1 and OR >1 indicate better results. Significant results are shown in bold. PFS: progression-free survival; OS: overall survival; HR: hazard ratio; OR: odds ratio; Atez: atezolizumab; Chem: chemotherapy; Nivo: nivolumab; Ipil: ipilimumab.
