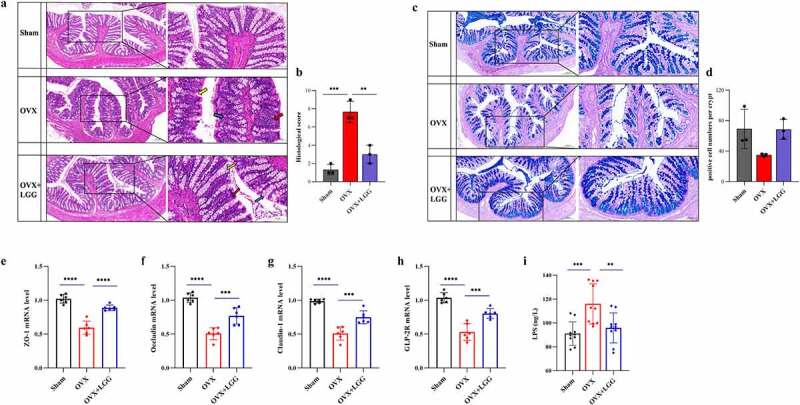
Figure 5.

Administration of LGG induces gut barrier reinforcement. (a) Representative pictures of HE-stained (scale bar, 200 µm, enlarged figure, 100 µm (n = 3). Red arrows, inflammatory infiltrates; blue arrows, goblet cells; yellow arrows, intestinal crypt). (b) Intestinal morphology studies measure cumulative scores including inflammation infiltration and crypt damage and goblet cells damage.The scoring criteria are shown in Supplementary Table 2. (c) Representative pictures of Ab-PAS stained (scale bar, 200 µm, enlarged figure 100 µm) (n = 3). (d) Morphological research measures include the number of goblet cells in the gland. (e-h) the mRNA expression of the ZO-1, occludin, claudin-1, and GLP-2 gene in colon tissue. (n = 6). (i) Serum LPS level. (n = 10). Data are expressed as mean ± standard deviation. *P < 0.01, **P < 0.001, ***P < 0.0001 (Dunnett multiple comparisons test). HE staining, hematoxylin-eosin staining; Ab-PAS stained, Alcian blue – periodic acid Schiff stain; ZO-1, Zonula Occludens-1; GLP-2, Glucagon-like Peptide-2; LPS, lipopolysaccharide; LGG, Lactobacillus rhamnosus.
