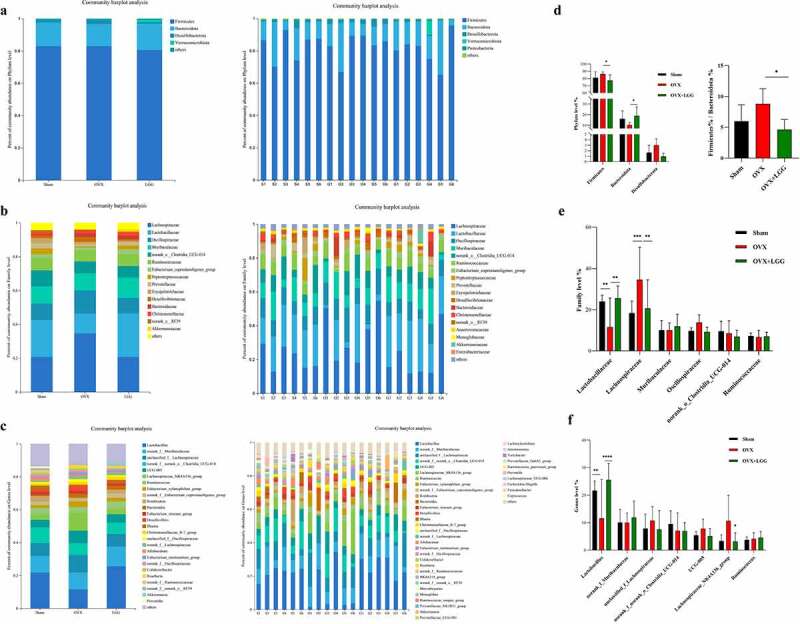
Figure 9.

Relative abundance analysis of gut microbiota at the multispecies level in different groups. (a-c) Relative abundances of the gut microbiota at the phylum, family, and genus levels. Each column represents a sample, and each column represents a group. (d-f) the three most abundant phylum, as well as the six most abundant families, and the seven most abundant genera were analyzed separately.
