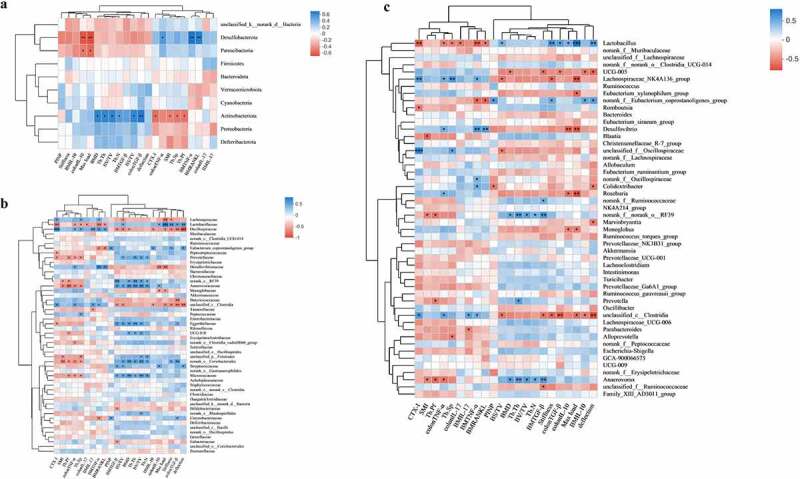
Figure 11.

Analysis of the correlation between gut microbiota, bone turnover indicators, and inflammation indicators. (a-c) Heat map of the correlations between 22 OGF and OCF, and gut microbiota at the phylum level, family level, genus level. *P < 0.5, **P < 0.01, ***P < 0.001; non-significant comparisons are indicated by no asterisk. Blue indicates a positive correlation; red indicates a negative correlation. OGF, osteogenic-related factors; OCF, osteoclastic-related factors.
