Figure 4.

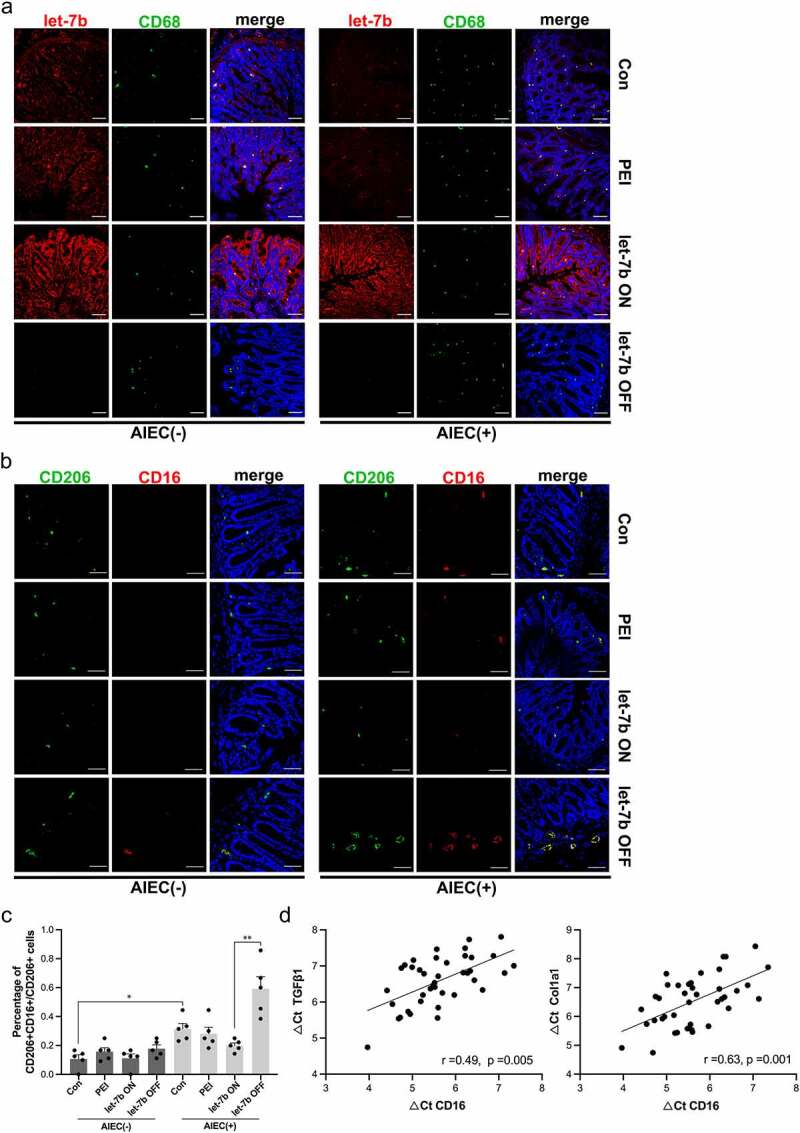
Localization of let-7b and Mø in colon tissue of IL-10−/− mice. (a) Immunofluorescence staining for the Mø marker CD68 and FISH for let-7b were performed on AIEC-infected or noninfected IL-10−/− mice treated with let-7b agomir/antagomir. (Red, let-7b; Green, CD68; Blue, DPAI). (b&c) Immunofluorescence analysis of the Mø phenotype. The Mø markers CD206 and CD16 were expressed on colon tissue from different groups. (Red, CD16; Green, CD206; Blue, DPAI). The ratio of profibrotic Mø was quantified by the number of CD16+CD206+ cells/CD206+ cells. (d) Correlation between the mRNA expression of CD16 and fibrotic markers TGFβ1 and Col1a1 in colon tissue. Spearman’s correlation analysis was applied. Data are expressed as the means ± SEM, n = 5 in each group. *P<.05, **P<.01.
