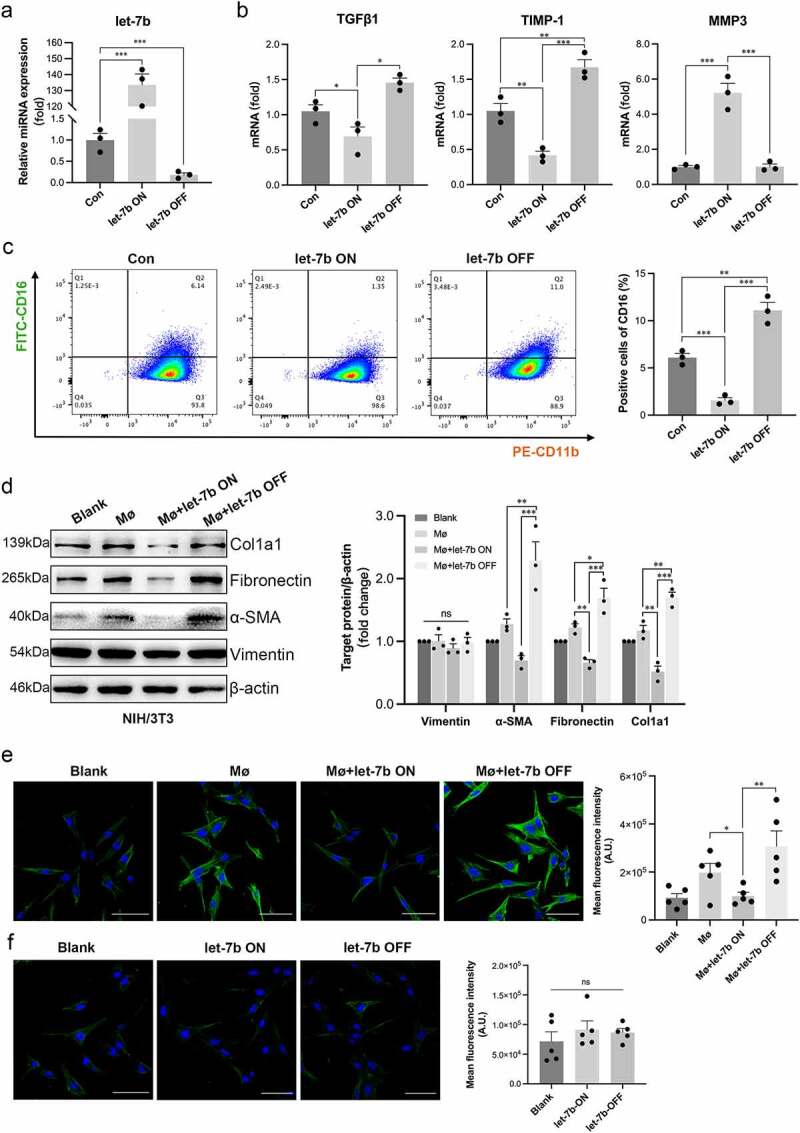
Figure 6.

Let-7b inhibits the pro-fibrotic capacity of Mø. (a) The let-7b levels in RAW264.7 with different treatments determined by qPCR. (b) The mRNA levels of the pro-fibrotic markers TGFβ1 and TIMP-1 and the collagen degradation indicator marker MMP3 in RAW264.7 determined by qPCR. Data were normalized to mouse 36B4 RNA. (c) The percentage of CD16+CD11b+ Mø was analyzed by flow cytometry. (d) The expression levels of various proteins indicating the activation of fibroblasts in NIH/3T3 examined by western blot. The densitometric intensity of the bands was quantified using ImageJ software. (e) The expression of α-SMA in NIH/3T3 after coculture with RAW264.7 detected with immunofluorescence staining and quantified by fluorescence intensity with ImageJ software. Scale bar, 20 μm. (f) Immunofluorescence staining of α-SMA in let-7b agomir/antagomir-transfected NIH/3T3. Fluorescence intensity was quantified with ImageJ software. Scale bar, 20 μm. Let-7b ON: upregulation of let-7b with let-7b agomir; let-7b OFF: inhibition of let-7b with let-7b antagomir. Data are expressed as the means ± SEM. (a-d) All the experiments repeated 3 times, (e&f) all the experiments repeated 5 times. *P<.05, **P<.01, ***P<.001.
